QUESTION IMAGE
Question
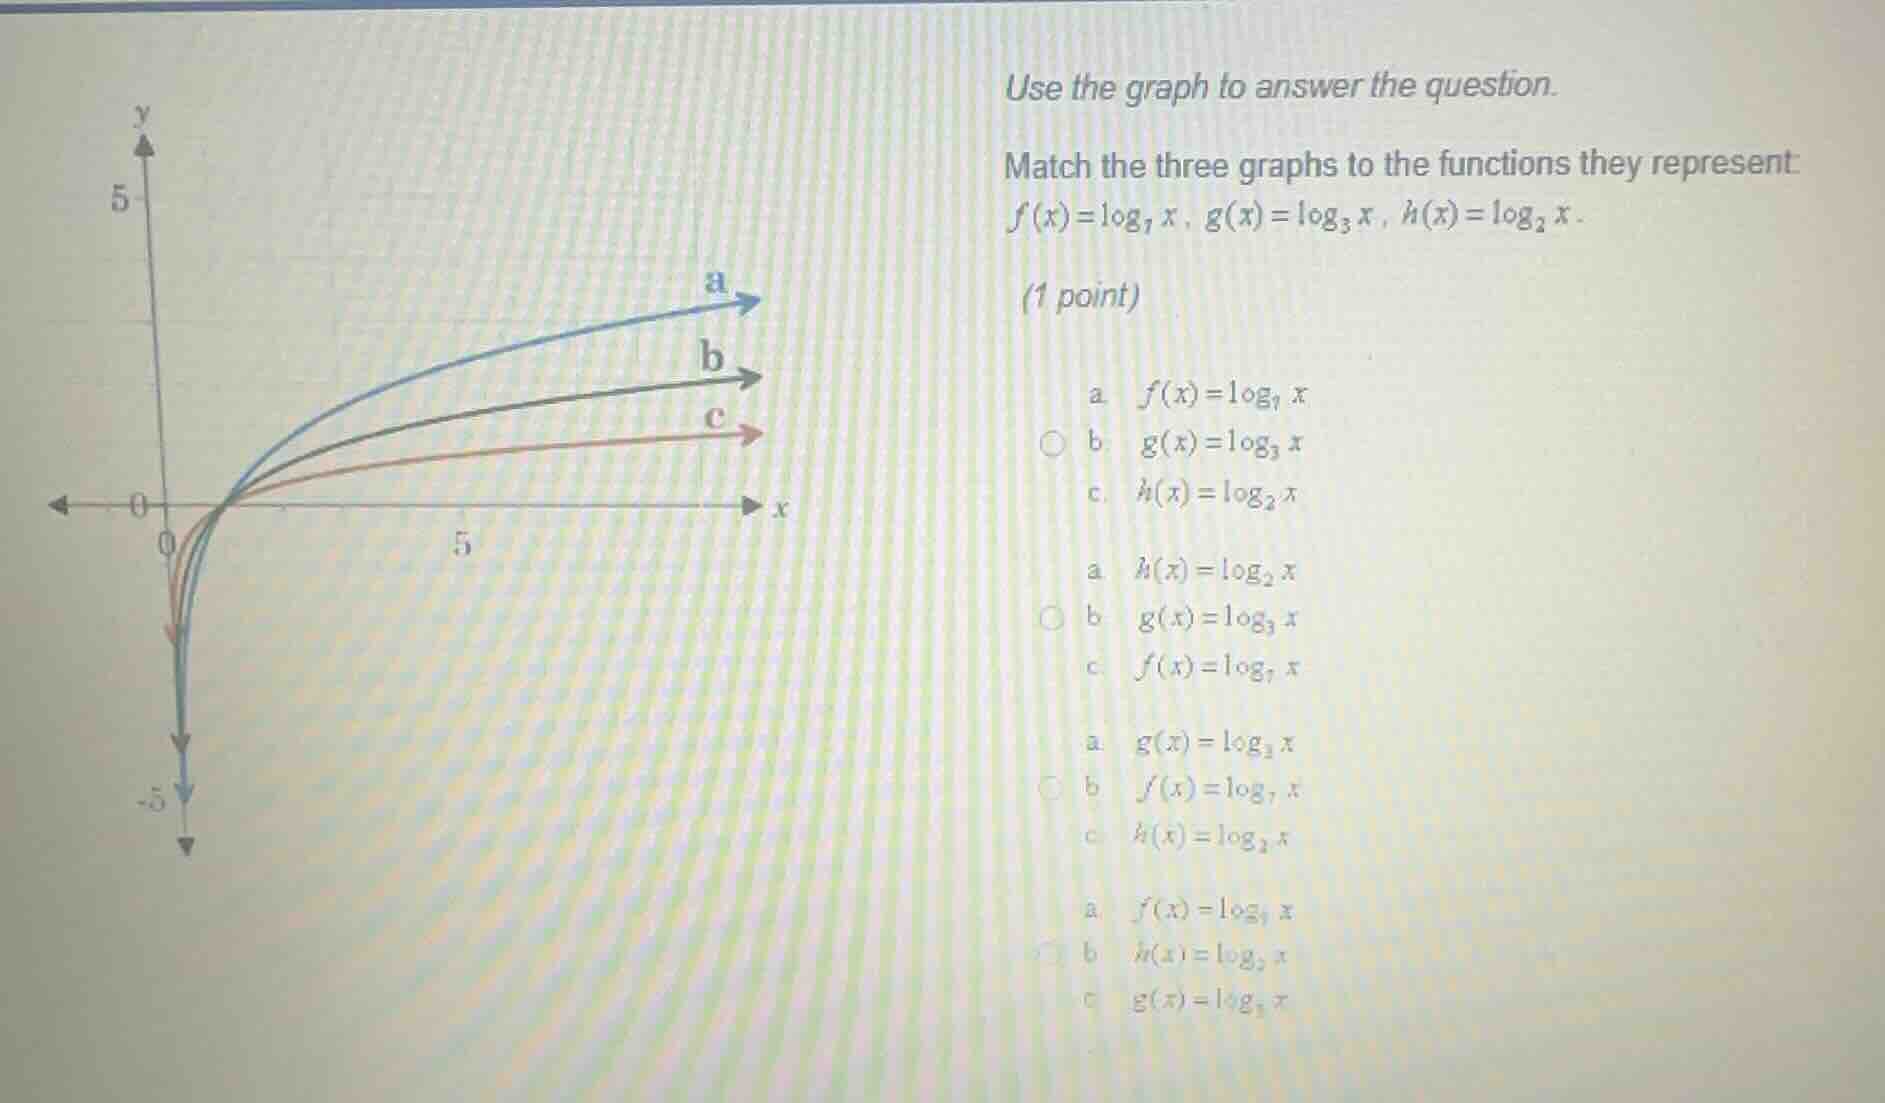
use the graph to answer the question. match the three graphs to the functions they represent: $f(x)=log_{7}x$, $g(x)=log_{3}x$, $h(x)=log_{2}x$. (1 point) \
\
\bigcirc \
\
\
\bigcirc \
\
\
\
\bigcirc \
\
\
\
\bigcirc \
To match the logarithmic functions to their graphs, we use the property of logarithmic functions: for \( y = \log_b x \), as the base \( b \) increases, the graph becomes less steep (flatter) for \( x>1 \) and less steep (closer to the x - axis) for \( 0 < x < 1 \).
Step 1: Analyze the bases of the functions
We have three functions: \( f(x)=\log_7 x \) (base \( b = 7 \)), \( g(x)=\log_3 x \) (base \( b = 3 \)), and \( h(x)=\log_2 x \) (base \( b = 2 \)). The order of the bases from smallest to largest is \( 2<3<7 \).
Step 2: Relate base size to graph steepness
- For \( x>1 \), the smaller the base of a logarithmic function \( y=\log_b x \), the steeper the graph. So, \( h(x)=\log_2 x \) (smallest base) will be the steepest, \( g(x)=\log_3 x \) will be less steep than \( h(x) \), and \( f(x)=\log_7 x \) (largest base) will be the least steep (flattest) for \( x > 1 \). Looking at the graphs, the steepest graph (for \( x>1 \)) is \( a \)? Wait, no, let's check the part where \( x \) is between 0 and 1. For \( 0 < x < 1 \), the larger the base \( b \) of \( y = \log_b x \), the closer the graph is to the x - axis (less steep in the negative y - direction). So, \( f(x)=\log_7 x \) (largest base) will be closest to the x - axis (least steep in negative y), \( g(x)=\log_3 x \) will be more steep than \( f(x) \), and \( h(x)=\log_2 x \) (smallest base) will be the steepest in the negative y - direction.
Looking at the three graphs (a, b, c) in the figure, for the part where \( x \) is between 0 and 1 (the left - hand side near \( x = 0 \)), the graph that is closest to the x - axis (least steep in negative y) is \( a \), then \( b \), then \( c \) (steepest in negative y). So, \( a \) corresponds to the function with the largest base (\( \log_7 x \)), \( b \) corresponds to the middle - sized base (\( \log_3 x \)), and \( c \) corresponds to the smallest base (\( \log_2 x \))? Wait, no, let's take a value of \( x \), say \( x = 1/2 \).
Calculate the values:
- \( h(1/2)=\log_2(1/2)=\log_2(2^{-1})=- 1\)
- \( g(1/2)=\log_3(1/2)=\frac{\ln(1/2)}{\ln(3)}\approx\frac{- 0.693}{1.099}\approx - 0.63\)
- \( f(1/2)=\log_7(1/2)=\frac{\ln(1/2)}{\ln(7)}\approx\frac{-0.693}{1.946}\approx - 0.356\)
So, when \( x = 1/2 \), \( h(x) \) has the most negative value (steepest in negative y), \( g(x) \) has a less negative value, and \( f(x) \) has the least negative value (closest to x - axis). So, the graph that is the steepest in negative y (most negative) is \( h(x)=\log_2 x \) (graph \( c \)? Wait, no, looking at the options. The second option set:
Option 2:
- a. \( h(x)=\log_2 x \) (steepest, most negative at \( x = 1/2 \))
- b. \( g(x)=\log_3 x \) (less negative than \( h(x) \))
- c. \( f(x)=\log_7 x \) (least negative, closest to x - axis)
Let's check the graphs. The graph that goes down the most (steepest negative) is \( a \)? No, wait the options:
The second option is:
a. \( h(x)=\log_2 x \)
b. \( g(x)=\log_3 x \)
c. \( f(x)=\log_7 x \)
Let's verify with \( x = 2 \):
- \( h(2)=\log_2(2) = 1\)
- \( g(2)=\log_3(2)=\frac{\ln(2)}{\ln(3)}\approx0.63\)
- \( f(2)=\log_7(2)=\frac{\ln(2)}{\ln(7)}\approx0.356\)
So, at \( x = 2 \), \( h(x) \) has the highest y - value (steepest positive slope), \( g(x) \) has a lower y - value than \( h(x) \), and \( f(x) \) has the lowest y - value (flattest positive slope). So, the graph with the highest y - value at \( x = 2 \) is \( a \), then \( b \), then \( c \). So, \( a \) is \( h(x)=\log_2 x \), \( b \) is \( g(x)=\log_3 x \), \( c \) is \( f(x)=\log_7 x \), which matches the second option.

Snap & solve any problem in the app
Get step-by-step solutions on Sovi AI
Photo-based solutions with guided steps
Explore more problems and detailed explanations
a. \( h(x)=\log_2 x \)
b. \( g(x)=\log_3 x \)
c. \( f(x)=\log_7 x \)