QUESTION IMAGE
Question
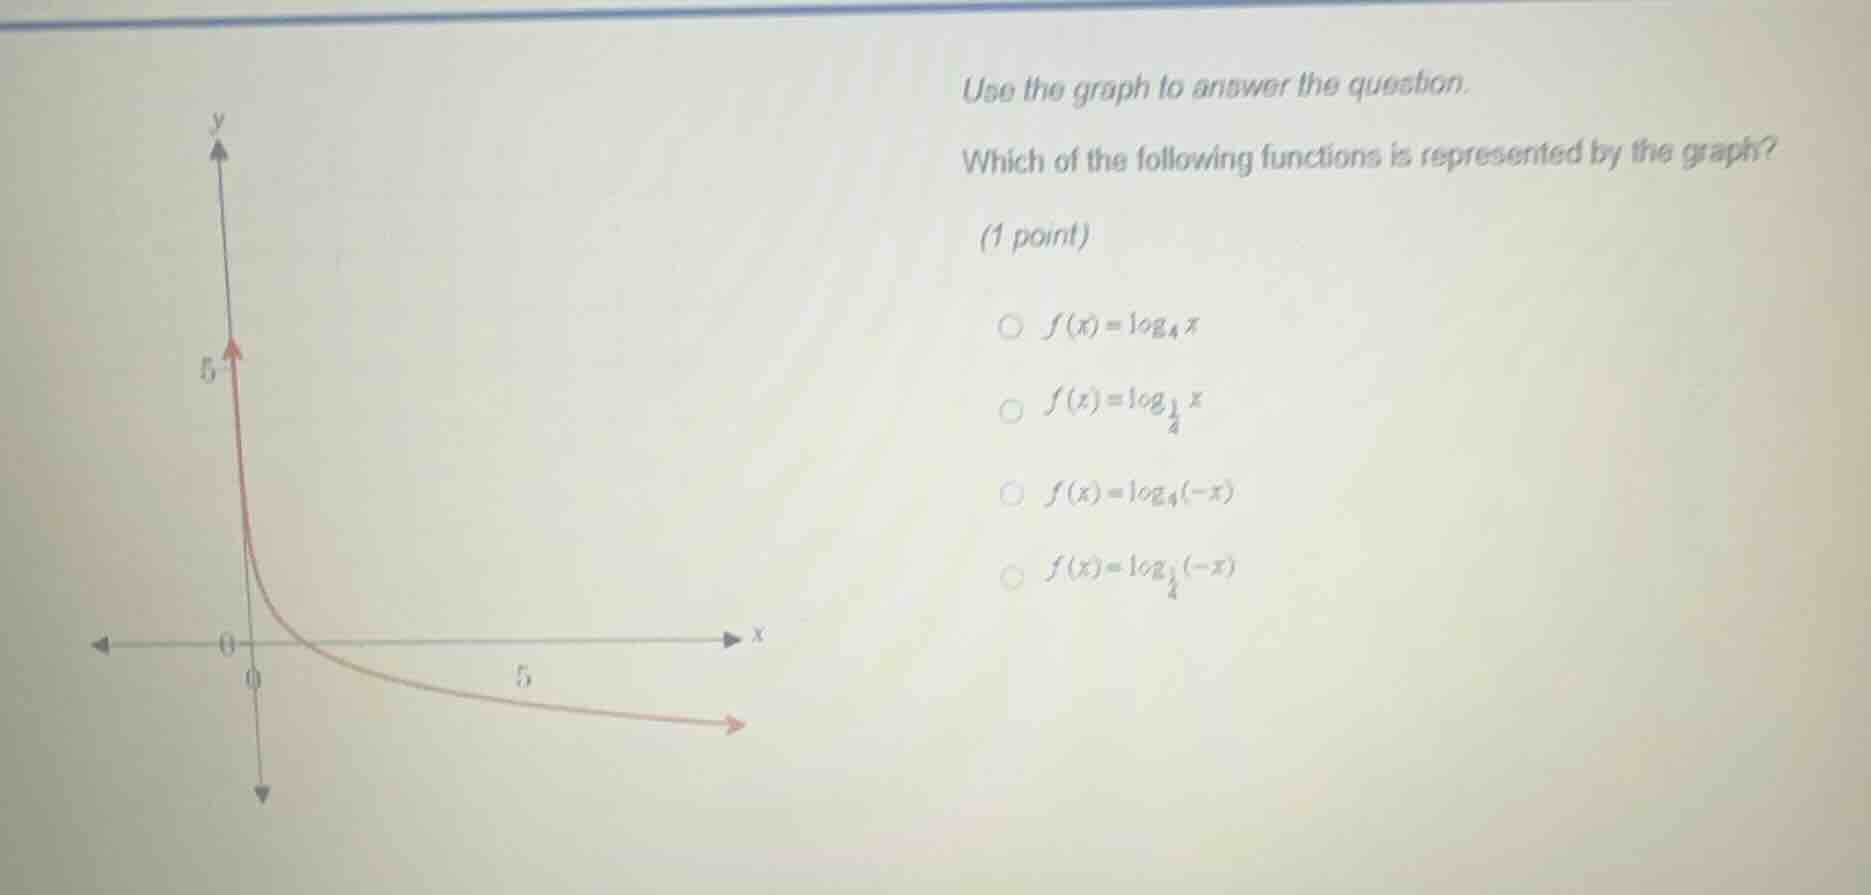
use the graph to answer the question. which of the following functions is represented by the graph? (1 point) $f(x)=log_{4}x$ $f(x)=log_{\frac{1}{4}}x$ $f(x)=log_{4}(-x)$ $f(x)=log_{\frac{1}{4}}(-x)$
Step1: Analyze domain of the graph
The graph is defined for \( x > 0 \)? Wait, no, looking at the graph, the curve is on the right side of the y - axis? Wait, no, the x - intercept: when \( y = 0 \), the graph crosses the x - axis at \( x>0 \)? Wait, no, let's check the domain of each function.
For \( f(x)=\log_{4}x \), domain is \( x > 0 \), and it is an increasing function (since base \( 4>1 \)).
For \( f(x)=\log_{\frac{1}{4}}x \), domain is \( x > 0 \), and it is a decreasing function (since base \( 0<\frac{1}{4}<1 \)).
For \( f(x)=\log_{4}(-x) \), domain is \( x < 0 \) (since \( -x>0\Rightarrow x < 0 \)).
For \( f(x)=\log_{\frac{1}{4}}(-x) \), domain is \( x < 0 \) (since \( -x>0\Rightarrow x < 0 \)). Wait, but the graph in the picture: the curve is on the right side of the y - axis? Wait, no, the x - axis: the origin is at (0,0), and the curve starts from the y - axis (x = 0) and goes to the right (x>0). Wait, maybe I misread. Wait, the graph: when x approaches 0 from the right, y is large positive, and as x increases, y decreases. Let's check the functions:
- \( f(x)=\log_{4}x \): base 4>1, so it's an increasing function (as x increases, y increases). But the graph is decreasing, so eliminate this.
- \( f(x)=\log_{\frac{1}{4}}x \): base \( \frac{1}{4}\in(0,1) \), so it's a decreasing function (as x increases, y decreases). Domain \( x > 0 \). Let's check the y - intercept: when x approaches 0 from the right, \( \log_{\frac{1}{4}}x=\frac{\ln x}{\ln\frac{1}{4}}=\frac{\ln x}{-\ln 4} \). As x approaches 0+, \( \ln x
ightarrow-\infty \), so \( y
ightarrow+\infty \), which matches the graph (starts high on the y - axis side). When x = 1, \( \log_{\frac{1}{4}}1 = 0 \), which matches the x - intercept (crosses x - axis at x = 1? Wait, the graph shows crossing near x = 0? Wait, no, maybe I made a mistake. Wait, the other functions:
- \( f(x)=\log_{4}(-x) \): domain \( x < 0 \), so the graph should be on the left side of the y - axis. But the given graph is on the right side (x>0), so eliminate.
- \( f(x)=\log_{\frac{1}{4}}(-x) \): domain \( x < 0 \), graph on left side, eliminate.
Wait, maybe the graph is actually on the right side, x>0. So between the first two: \( \log_{4}x \) is increasing, \( \log_{\frac{1}{4}}x \) is decreasing. The graph is decreasing, so \( f(x)=\log_{\frac{1}{4}}x \)? Wait, but let's re - check. Wait, the options:
Wait, the first option: \( f(x)=\log_{4}x \) (increasing, x>0)
Second: \( f(x)=\log_{\frac{1}{4}}x \) (decreasing, x>0)
Third: \( f(x)=\log_{4}(-x) \) (domain x<0, so left side)
Fourth: \( f(x)=\log_{\frac{1}{4}}(-x) \) (domain x<0, left side)
The graph in the picture: the curve starts from the y - axis (x = 0) and goes to the right (x>0), decreasing as x increases. So the function should be \( f(x)=\log_{\frac{1}{4}}x \), because it's decreasing, domain x>0, and as x approaches 0+, y approaches +∞, and as x increases, y decreases.
Wait, but let's check the x - intercept: when y = 0, \( \log_{\frac{1}{4}}x = 0\Rightarrow x = 1 \), which would mean the graph crosses the x - axis at x = 1. The given graph seems to cross near x = 0, but maybe it's a rough sketch. Alternatively, maybe I misread the graph. Wait, the original graph: the red curve starts at (0,5) (approx) and goes down to cross the x - axis near x = 0? No, that can't be, because for \( \log_{\frac{1}{4}}x \), when x = 1, y = 0. If the graph crosses the x - axis at x = 1, then \( f(x)=\log_{\frac{1}{4}}x \) is correct.
Wait, maybe the graph is a rough sketch, and the key is the domain and the direction (increasing/decrea…

Snap & solve any problem in the app
Get step-by-step solutions on Sovi AI
Photo-based solutions with guided steps
Explore more problems and detailed explanations
\( f(x)=\log_{\frac{1}{4}}x \) (the second option)