QUESTION IMAGE
Question
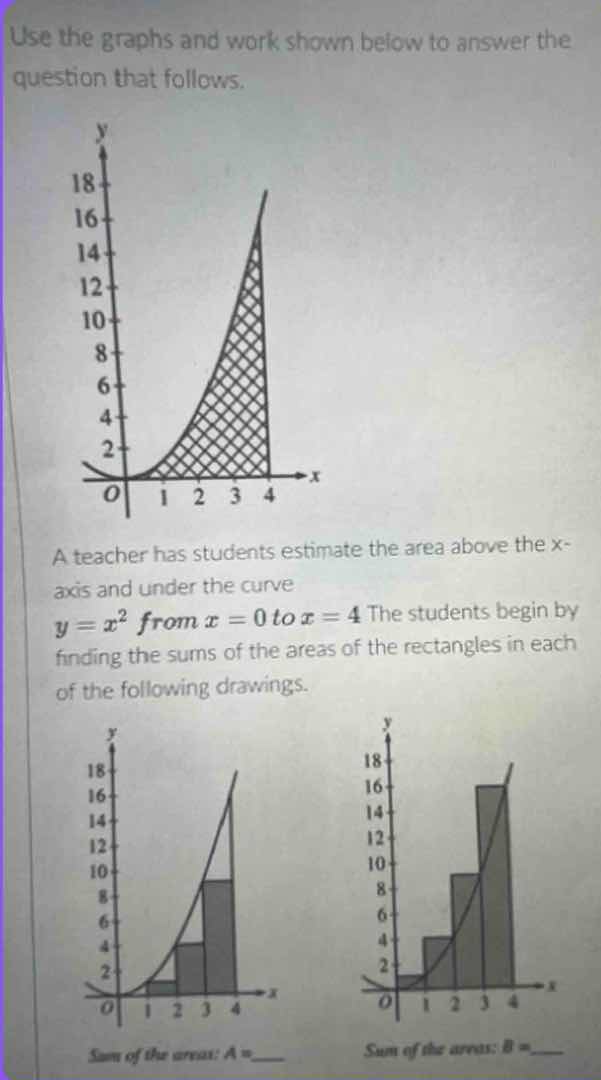
use the graphs and work shown below to answer the question that follows.
a teacher has students estimate the area above the x - axis and under the curve ( y = x^2 ) from ( x = 0 ) to ( x = 4 ). the students begin by finding the sums of the areas of the rectangles in each of the following drawings.
sum of the areas: ( aapprox)
sum of the areas: ( bapprox)
To solve for the sums of the areas of the rectangles (A and B) for the curve \( y = x^2 \) from \( x = 0 \) to \( x = 4 \), we analyze each case:
Calculating Sum of Areas \( A \) (Right - Endpoint Rectangles, 4 sub - intervals? Wait, looking at the first lower graph: the rectangles seem to have widths. Let's check the intervals. From \( x = 0 \) to \( x = 4 \), if we divide into sub - intervals of width \( \Delta x=1 \) (since from 0 - 1, 1 - 2, 2 - 3, 3 - 4). For the first lower graph (Sum A), the rectangles are drawn with right - endpoints? Wait, no, looking at the first lower graph: at \( x = 1 \), the height is \( 1^2 = 1 \); at \( x = 2 \), height \( 2^2=4 \); at \( x = 3 \), height \( 3^2 = 9 \); at \( x = 4 \), height \( 4^2=16 \)? Wait, no, the first lower graph (Sum A) has rectangles with widths 1, and the heights are at \( x = 1,2,3,4 \)? Wait, no, the first lower graph (the left - most lower graph) has rectangles: from \( x = 1 \) to \( x = 2 \), height \( 1^2=1 \); \( x = 2 \) to \( x = 3 \), height \( 2^2 = 4 \); \( x = 3 \) to \( x = 4 \), height \( 3^2=9 \). Wait, the width of each rectangle is \( \Delta x = 1 \).
Step 1: Calculate Area for Sum \( A \)
The formula for the area of each rectangle is \( \text{Area}=\text{width}\times\text{height} \). The width of each rectangle \( \Delta x=\frac{4 - 0}{4}=1 \) (since we divide the interval \([0,4]\) into 4 sub - intervals of width 1).
- For the rectangle from \( x = 1 \) to \( x = 2 \): width \( \Delta x = 1 \), height \( y(1)=1^2 = 1 \), area \(=1\times1 = 1\)
- For the rectangle from \( x = 2 \) to \( x = 3 \): width \( \Delta x = 1 \), height \( y(2)=2^2=4 \), area \(=1\times4 = 4\)
- For the rectangle from \( x = 3 \) to \( x = 4 \): width \( \Delta x = 1 \), height \( y(3)=3^2 = 9 \), area \(=1\times9=9\)
Wait, but what about the rectangle from \( x = 0 \) to \( x = 1 \)? In the first lower graph, the first rectangle (from \( x = 0 \) to \( x = 1 \)) seems to have a very small height, maybe \( y(0)=0 \)? Wait, no, looking at the first lower graph: the first rectangle (left - most) has height \( 1^2 = 1 \)? Wait, maybe the sub - intervals are \( [1,2],[2,3],[3,4] \)? No, the total interval is from \( x = 0 \) to \( x = 4 \). Let's re - examine.
Wait, the function is \( y=x^2 \), and we want to estimate the area under the curve from \( x = 0 \) to \( x = 4 \) using rectangles.
For Sum \( A \) (the left - most lower graph):
The rectangles are:
- From \( x = 1 \) to \( x = 2 \): width \( \Delta x = 1 \), height \( f(1)=1^2 = 1 \), area \(=1\times1=1\)
- From \( x = 2 \) to \( x = 3 \): width \( \Delta x = 1 \), height \( f(2)=2^2 = 4 \), area \(=1\times4 = 4\)
- From \( x = 3 \) to \( x = 4 \): width \( \Delta x = 1 \), height \( f(3)=3^2=9 \), area \(=1\times9 = 9\)
Wait, but what about \( x = 0 \) to \( x = 1 \)? The first rectangle (at \( x = 0 \) to \( x = 1 \)) has height \( f(0)=0 \), so area \(=1\times0 = 0\). So total area \( A=0 + 1+4 + 9=14 \)? Wait, no, maybe the sub - intervals are of width 1, and we use right - endpoints? Wait, no, let's check the second lower graph (Sum B).
For Sum \( B \) (the right - most lower graph):
The rectangles are:
- From \( x = 0 \) to \( x = 1 \): width \( \Delta x = 1 \), height \( f(1)=1^2 = 1 \), area \(=1\times1 = 1\)
- From \( x = 1 \) to \( x = 2 \): width \( \Delta x = 1 \), height \( f(2)=2^2=4 \), area \(=1\times4 = 4\)
- From \( x = 2 \) to \( x = 3 \): width \( \Delta x = 1 \), height \( f(3)=3^2 = 9 \), area \(=1\times9=9\)
- From \( x = 3 \) to \( x = 4 \): width \( \Delta x = 1 \), height \( f(4…

Snap & solve any problem in the app
Get step-by-step solutions on Sovi AI
Photo-based solutions with guided steps
Explore more problems and detailed explanations
To solve for the sums of the areas of the rectangles (A and B) for the curve \( y = x^2 \) from \( x = 0 \) to \( x = 4 \), we analyze each case:
Calculating Sum of Areas \( A \) (Right - Endpoint Rectangles, 4 sub - intervals? Wait, looking at the first lower graph: the rectangles seem to have widths. Let's check the intervals. From \( x = 0 \) to \( x = 4 \), if we divide into sub - intervals of width \( \Delta x=1 \) (since from 0 - 1, 1 - 2, 2 - 3, 3 - 4). For the first lower graph (Sum A), the rectangles are drawn with right - endpoints? Wait, no, looking at the first lower graph: at \( x = 1 \), the height is \( 1^2 = 1 \); at \( x = 2 \), height \( 2^2=4 \); at \( x = 3 \), height \( 3^2 = 9 \); at \( x = 4 \), height \( 4^2=16 \)? Wait, no, the first lower graph (Sum A) has rectangles with widths 1, and the heights are at \( x = 1,2,3,4 \)? Wait, no, the first lower graph (the left - most lower graph) has rectangles: from \( x = 1 \) to \( x = 2 \), height \( 1^2=1 \); \( x = 2 \) to \( x = 3 \), height \( 2^2 = 4 \); \( x = 3 \) to \( x = 4 \), height \( 3^2=9 \). Wait, the width of each rectangle is \( \Delta x = 1 \).
Step 1: Calculate Area for Sum \( A \)
The formula for the area of each rectangle is \( \text{Area}=\text{width}\times\text{height} \). The width of each rectangle \( \Delta x=\frac{4 - 0}{4}=1 \) (since we divide the interval \([0,4]\) into 4 sub - intervals of width 1).
- For the rectangle from \( x = 1 \) to \( x = 2 \): width \( \Delta x = 1 \), height \( y(1)=1^2 = 1 \), area \(=1\times1 = 1\)
- For the rectangle from \( x = 2 \) to \( x = 3 \): width \( \Delta x = 1 \), height \( y(2)=2^2=4 \), area \(=1\times4 = 4\)
- For the rectangle from \( x = 3 \) to \( x = 4 \): width \( \Delta x = 1 \), height \( y(3)=3^2 = 9 \), area \(=1\times9=9\)
Wait, but what about the rectangle from \( x = 0 \) to \( x = 1 \)? In the first lower graph, the first rectangle (from \( x = 0 \) to \( x = 1 \)) seems to have a very small height, maybe \( y(0)=0 \)? Wait, no, looking at the first lower graph: the first rectangle (left - most) has height \( 1^2 = 1 \)? Wait, maybe the sub - intervals are \( [1,2],[2,3],[3,4] \)? No, the total interval is from \( x = 0 \) to \( x = 4 \). Let's re - examine.
Wait, the function is \( y=x^2 \), and we want to estimate the area under the curve from \( x = 0 \) to \( x = 4 \) using rectangles.
For Sum \( A \) (the left - most lower graph):
The rectangles are:
- From \( x = 1 \) to \( x = 2 \): width \( \Delta x = 1 \), height \( f(1)=1^2 = 1 \), area \(=1\times1=1\)
- From \( x = 2 \) to \( x = 3 \): width \( \Delta x = 1 \), height \( f(2)=2^2 = 4 \), area \(=1\times4 = 4\)
- From \( x = 3 \) to \( x = 4 \): width \( \Delta x = 1 \), height \( f(3)=3^2=9 \), area \(=1\times9 = 9\)
Wait, but what about \( x = 0 \) to \( x = 1 \)? The first rectangle (at \( x = 0 \) to \( x = 1 \)) has height \( f(0)=0 \), so area \(=1\times0 = 0\). So total area \( A=0 + 1+4 + 9=14 \)? Wait, no, maybe the sub - intervals are of width 1, and we use right - endpoints? Wait, no, let's check the second lower graph (Sum B).
For Sum \( B \) (the right - most lower graph):
The rectangles are:
- From \( x = 0 \) to \( x = 1 \): width \( \Delta x = 1 \), height \( f(1)=1^2 = 1 \), area \(=1\times1 = 1\)
- From \( x = 1 \) to \( x = 2 \): width \( \Delta x = 1 \), height \( f(2)=2^2=4 \), area \(=1\times4 = 4\)
- From \( x = 2 \) to \( x = 3 \): width \( \Delta x = 1 \), height \( f(3)=3^2 = 9 \), area \(=1\times9=9\)
- From \( x = 3 \) to \( x = 4 \): width \( \Delta x = 1 \), height \( f(4)=4^2 = 16 \), area \(=1\times16=16\)
So total area \( B=1 + 4+9 + 16=30 \)
Wait, but for Sum \( A \), if we use left - endpoints:
- From \( x = 0 \) to \( x = 1 \): height \( f(0)=0 \), area \(=1\times0 = 0\)
- From \( x = 1 \) to \( x = 2 \): height \( f(1)=1 \), area \(=1\times1 = 1\)
- From \( x = 2 \) to \( x = 3 \): height \( f(2)=4 \), area \(=1\times4 = 4\)
- From \( x = 3 \) to \( x = 4 \): height \( f(3)=9 \), area \(=1\times9 = 9\)
So \( A=0 + 1+4 + 9=14 \)
Final Answers
- Sum of the areas \( A=\boldsymbol{14} \)
- Sum of the areas \( B=\boldsymbol{30} \)