QUESTION IMAGE
Question
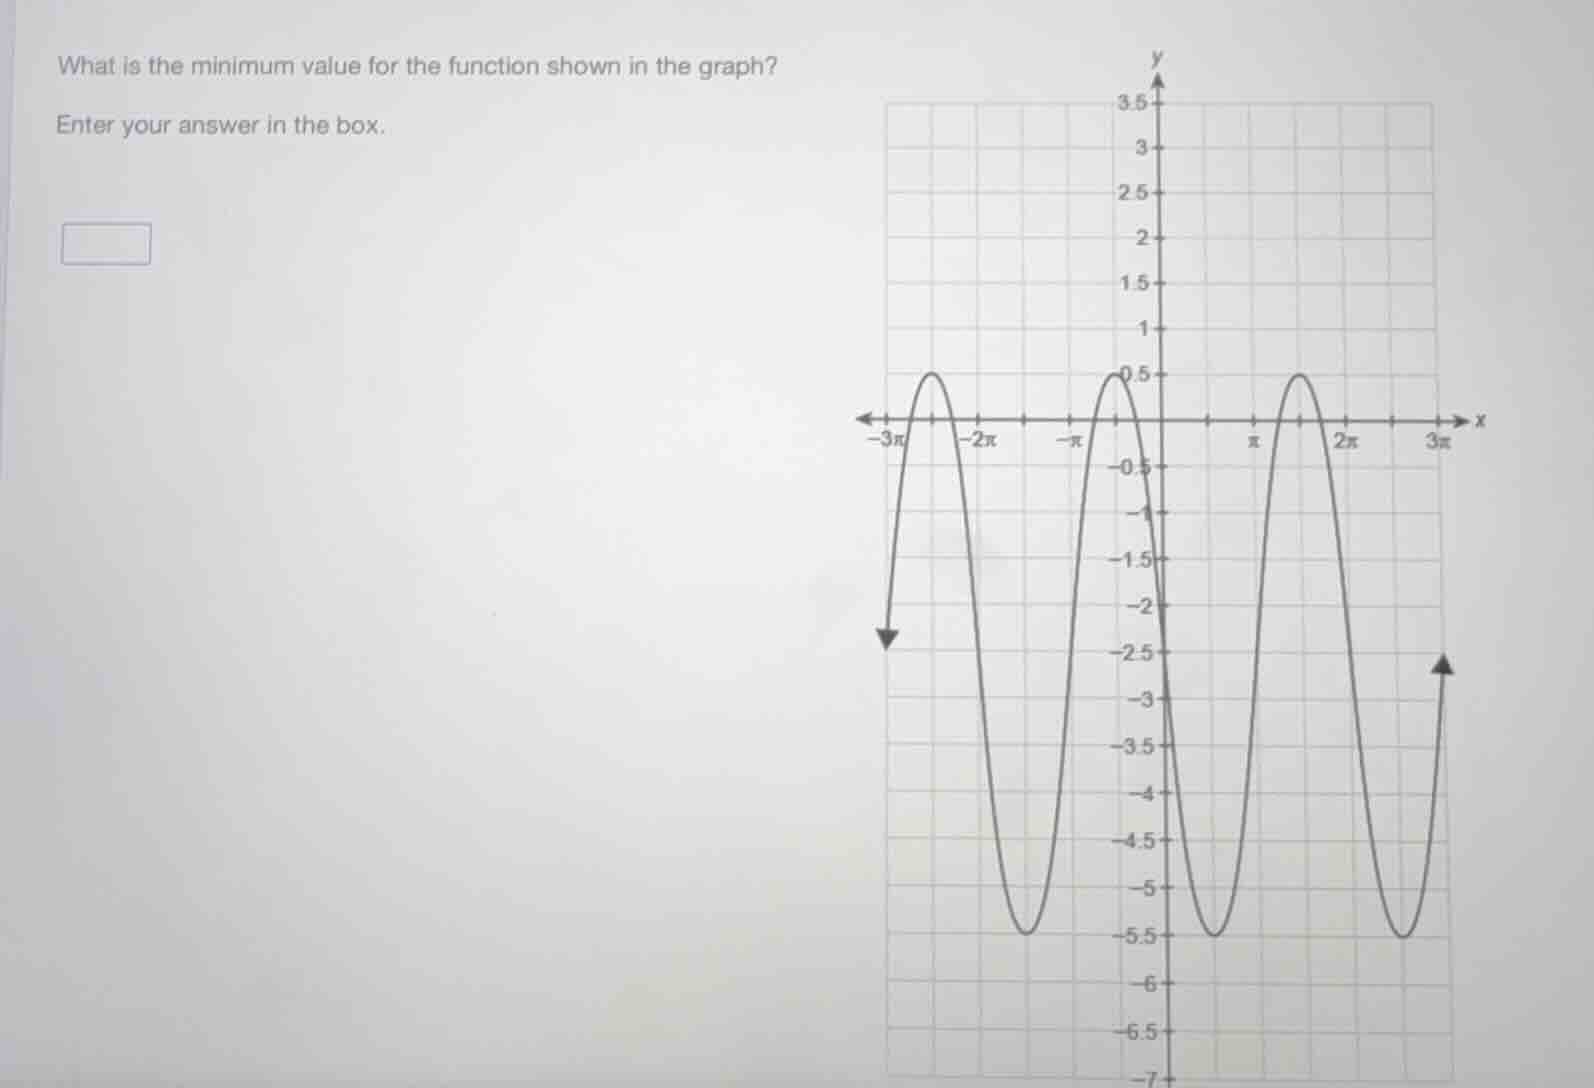
what is the minimum value for the function shown in the graph? enter your answer in the box.
Step1: Identify the minimum point
Look at the graph to find the lowest point (minimum value) of the function. The graph has troughs (minimum points) at certain y - values. By observing the y - axis scale and the position of the lowest points on the graph, we can see that the minimum y - value (the minimum value of the function) is - 5.5.

Snap & solve any problem in the app
Get step-by-step solutions on Sovi AI
Photo-based solutions with guided steps
Explore more problems and detailed explanations
-5.5