QUESTION IMAGE
Question
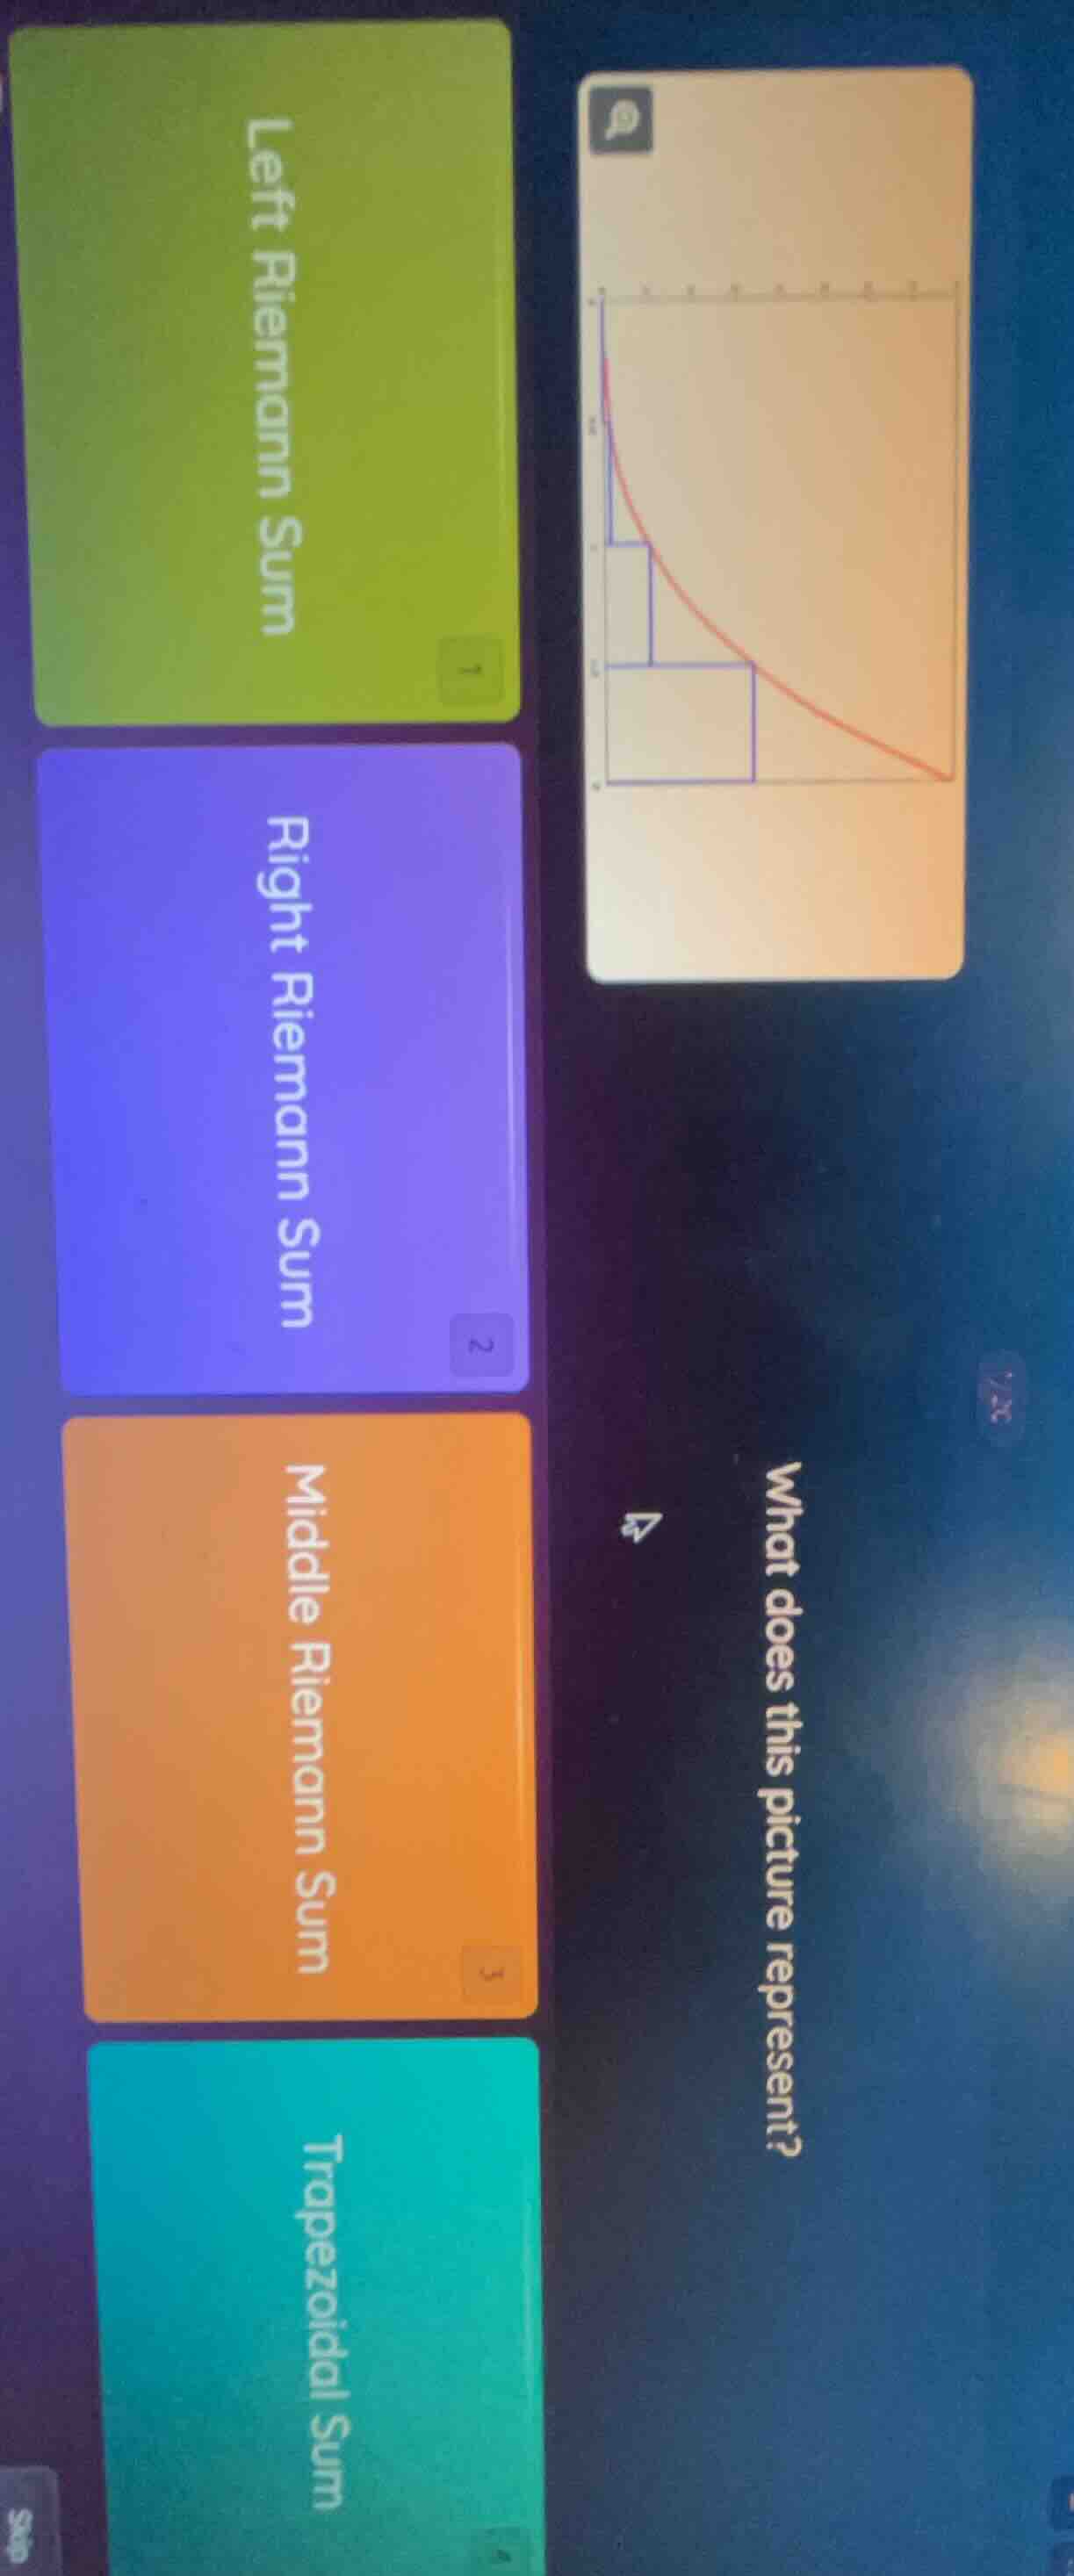
what does this picture represent? left riemann sum right riemann sum middle riemann sum trapezoidal sum
Brief Explanations
The graph shows rectangles where the height of each rectangle is determined by the function's value at the left endpoint of each subinterval, which matches the definition of a Left Riemann Sum.

Snap & solve any problem in the app
Get step-by-step solutions on Sovi AI
Photo-based solutions with guided steps
Explore more problems and detailed explanations
- Left Riemann Sum