QUESTION IMAGE
Question
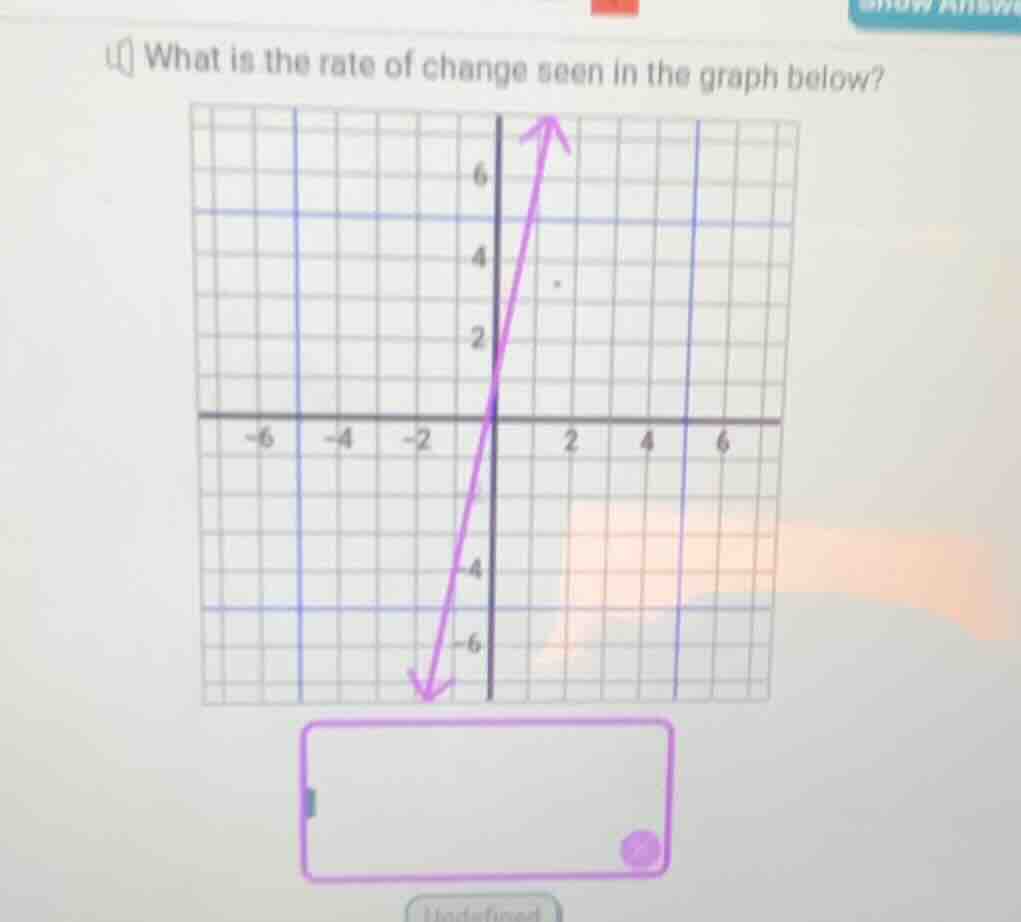
what is the rate of change seen in the graph below?
Step1: Identify two points on the line
The line passes through the origin \((0,0)\) and another point, say \((1, 3)\) (we can also use \((-1, -3)\) or other points). Let's take \((0,0)\) and \((1, 3)\).
Step2: Use the slope formula
The rate of change (slope) \(m\) is given by \(m=\frac{y_2 - y_1}{x_2 - x_1}\). Substituting \((x_1,y_1)=(0,0)\) and \((x_2,y_2)=(1,3)\), we get \(m=\frac{3 - 0}{1 - 0}=\frac{3}{1}=3\). We can also check with another point, like \((-1,-3)\): \(m=\frac{-3 - 0}{-1 - 0}=\frac{-3}{-1}=3\). So the slope (rate of change) is 3.

Snap & solve any problem in the app
Get step-by-step solutions on Sovi AI
Photo-based solutions with guided steps
Explore more problems and detailed explanations
3