QUESTION IMAGE
Question
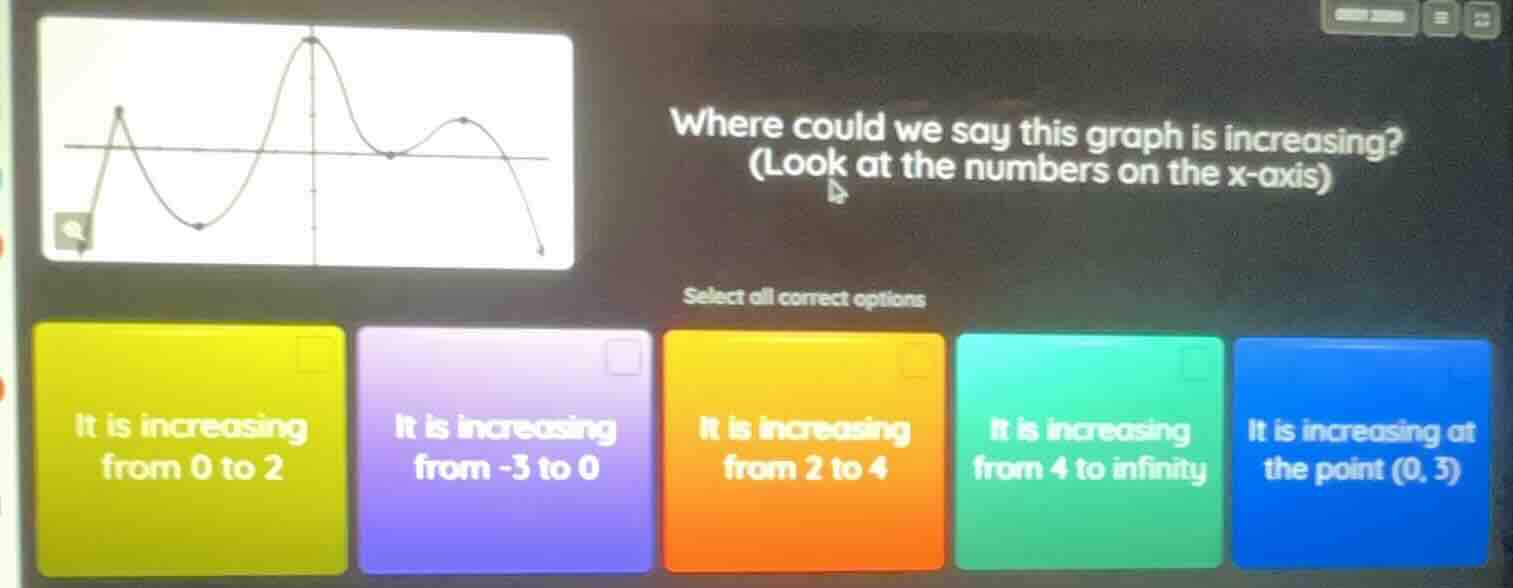
where could we say this graph is increasing? (look at the numbers on the x - axis) select all correct options it is increasing from 0 to 2 it is increasing from - 3 to 0 it is increasing from 2 to 4 it is increasing from 4 to infinity it is increasing at the point (0, 3)
Brief Explanations
To determine where a graph is increasing, we look at intervals where as \( x \) increases, \( y \) (the function value) also increases.
- From -3 to 0: As \( x \) moves from -3 towards 0, the graph rises (y - values increase), so this interval is increasing.
- From 2 to 4: As \( x \) moves from 2 towards 4, the graph rises (y - values increase), so this interval is increasing.
- From 0 to 2: The graph is decreasing (y - values fall) as \( x \) goes from 0 to 2.
- From 4 to infinity: The graph is decreasing (y - values fall) as \( x \) goes from 4 to infinity.
- At the point (0, 3): A function's "increasing" or "decreasing" is defined over intervals, not at a single point (the derivative at a point tells us about the slope at that point, but the question is about intervals of increase). So the point - based option is incorrect.

Snap & solve any problem in the app
Get step-by-step solutions on Sovi AI
Photo-based solutions with guided steps
Explore more problems and detailed explanations
B. It is increasing from -3 to 0, C. It is increasing from 2 to 4