QUESTION IMAGE
Question
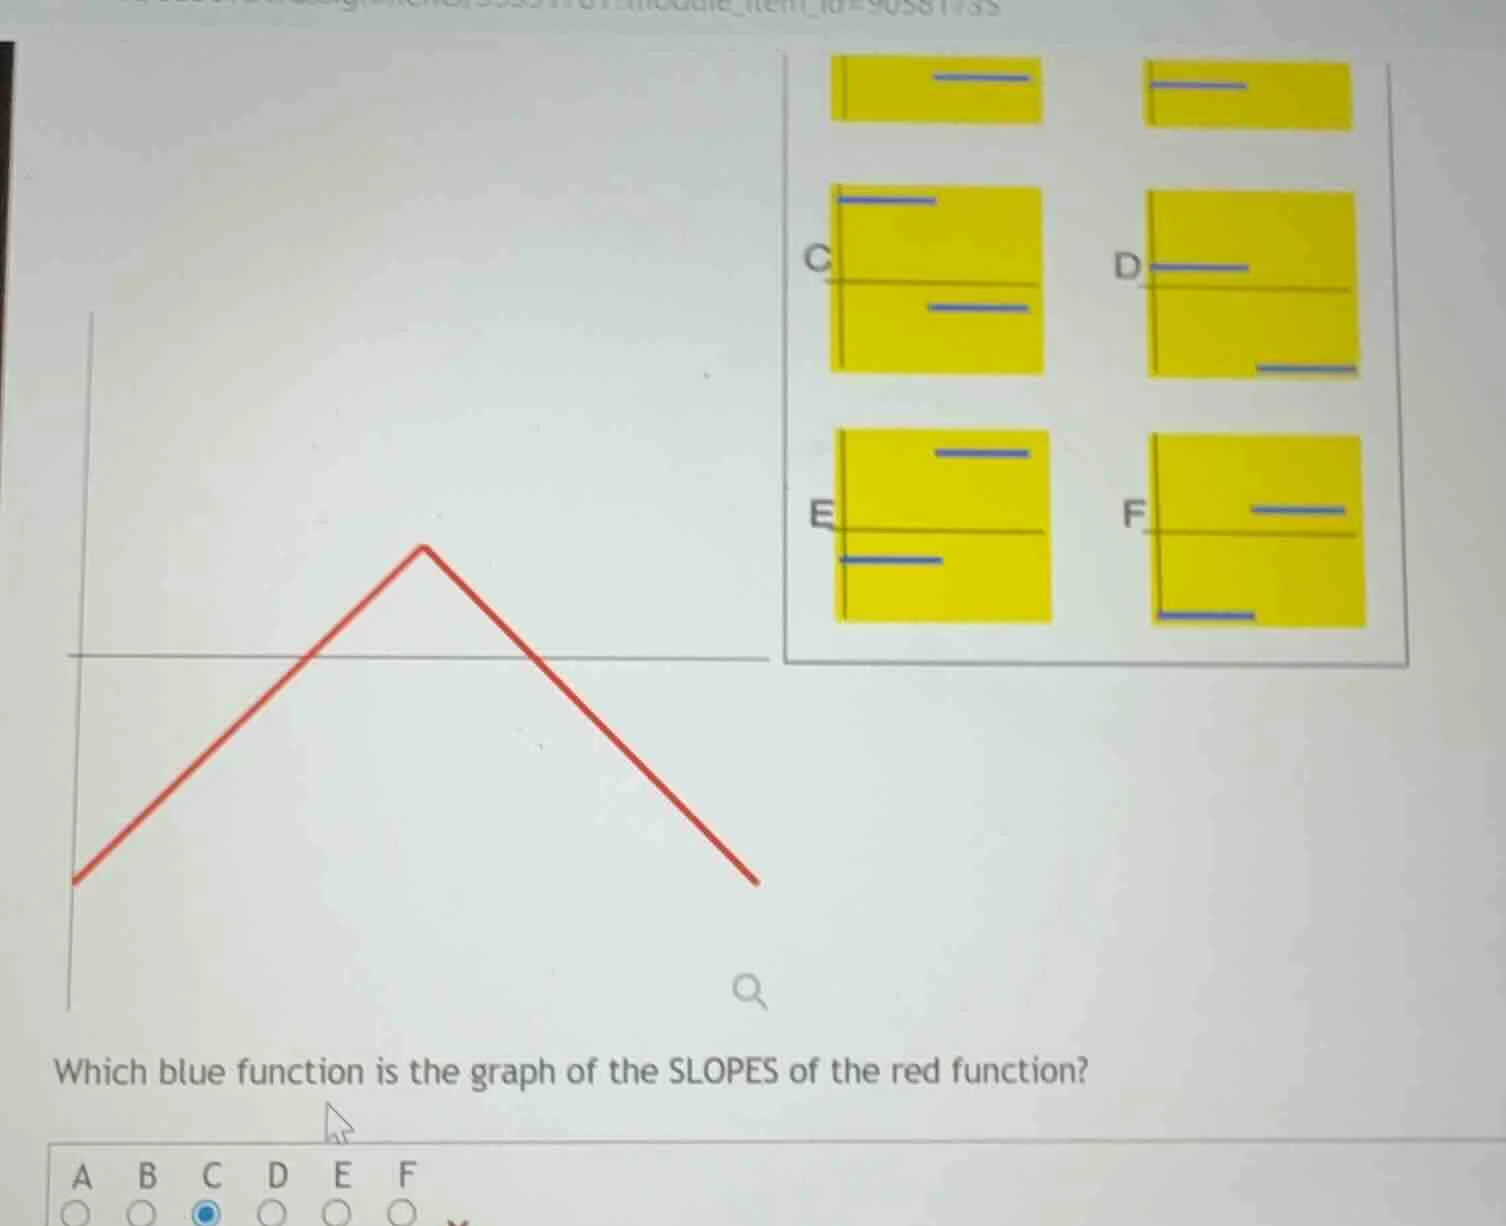
which blue function is the graph of the slopes of the red function?
a b c d e f
Step1: Analyze left segment slope
The left red line rises from left to right, so its slope is positive (a constant positive value).
Step2: Analyze right segment slope
The right red line falls from left to right, so its slope is negative (a constant negative value).
Step3: Match to blue graph
We need a graph with a positive horizontal line (for left slope) and a negative horizontal line (for right slope), which matches option C.

Snap & solve any problem in the app
Get step-by-step solutions on Sovi AI
Photo-based solutions with guided steps
Explore more problems and detailed explanations
C