QUESTION IMAGE
Question
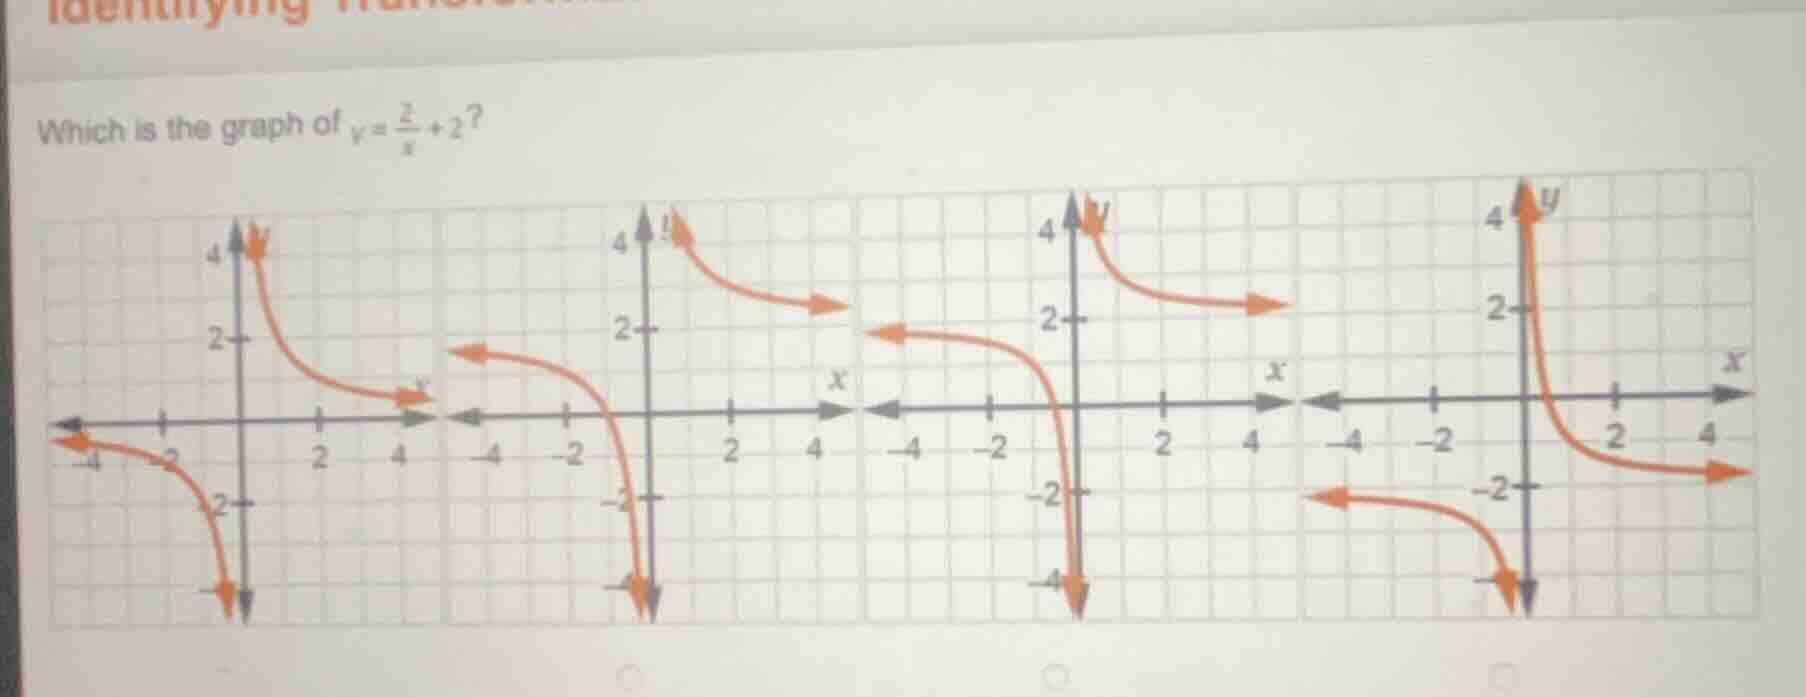
which is the graph of $y = \frac{2}{x} + 2$?
Step1: Analyze the parent function
The given function is \( y=\frac{2}{x}+2 \). The parent function is \( y = \frac{2}{x} \), which is a hyperbola with vertical asymptote \( x = 0 \) and horizontal asymptote \( y=0 \).
Step2: Determine the transformations
For the function \( y=\frac{2}{x}+2 \), we have a vertical shift of the parent function \( y = \frac{2}{x} \) by 2 units upward. So the horizontal asymptote of \( y=\frac{2}{x}+2 \) will be \( y = 2 \) (since we shift the horizontal asymptote \( y = 0 \) of the parent function up by 2 units), and the vertical asymptote remains \( x=0 \) (the y - axis).
Step3: Analyze the quadrants
For the parent function \( y=\frac{2}{x} \), when \( x>0 \), \( y>0 \) (so the graph is in the first quadrant), and when \( x < 0 \), \( y<0 \) (so the graph is in the third quadrant). After the vertical shift \( y=\frac{2}{x}+2 \), when \( x>0 \), \( y=\frac{2}{x}+2>0 + 2=2>0 \), so the part of the graph for \( x>0 \) is still in the first quadrant (above \( y = 2 \) when \( x\) is small positive). When \( x<0 \), \( y=\frac{2}{x}+2\). Let's take \( x=- 1\), then \( y=\frac{2}{-1}+2=-2 + 2=0\); when \( x=-2\), \( y=\frac{2}{-2}+2=-1 + 2 = 1>0\). So for \( x<0 \), the graph of \( y=\frac{2}{x}+2\) is in the second quadrant (since when \( x<0\), \( y=\frac{2}{x}+2\) can be positive: for example, when \( x=-1\), \( y = 0\); when \( x=-0.5\), \( y=\frac{2}{-0.5}+2=-4 + 2=-2<0\)? Wait, no, let's recalculate. If \( x=-0.5\), \( y=\frac{2}{-0.5}+2=-4 + 2=-2\). Wait, maybe my earlier thought was wrong. Wait, the parent function \( y = \frac{2}{x}\) for \( x<0\) has \( y<0 \). After adding 2, \( y=\frac{2}{x}+2\). Let's find when \( y = 0\): \( \frac{2}{x}+2=0\Rightarrow\frac{2}{x}=-2\Rightarrow x=-1\). So when \( x < - 1\), \( \frac{2}{x}>-2\) (because if \( x=-2\), \( \frac{2}{-2}=-1>-2\)), so \( y=\frac{2}{x}+2>-2 + 2=0\). When \( - 1 The first graph: For \( x>0\), the graph is in the first quadrant (above \( y = 2\) when \( x\) is small), and for \( x<0\), the graph is in the second quadrant (since when \( x<0\), the graph is above the x - axis for \( x < - 1\) and crosses the x - axis at \( x=-1\) and goes below for \( - 1 Looking at the four graphs:

Snap & solve any problem in the app
Get step-by-step solutions on Sovi AI
Photo-based solutions with guided steps
Explore more problems and detailed explanations
The left - most graph (the first graph in the given set of four graphs) is the graph of \( y=\frac{2}{x}+2\).