QUESTION IMAGE
Question
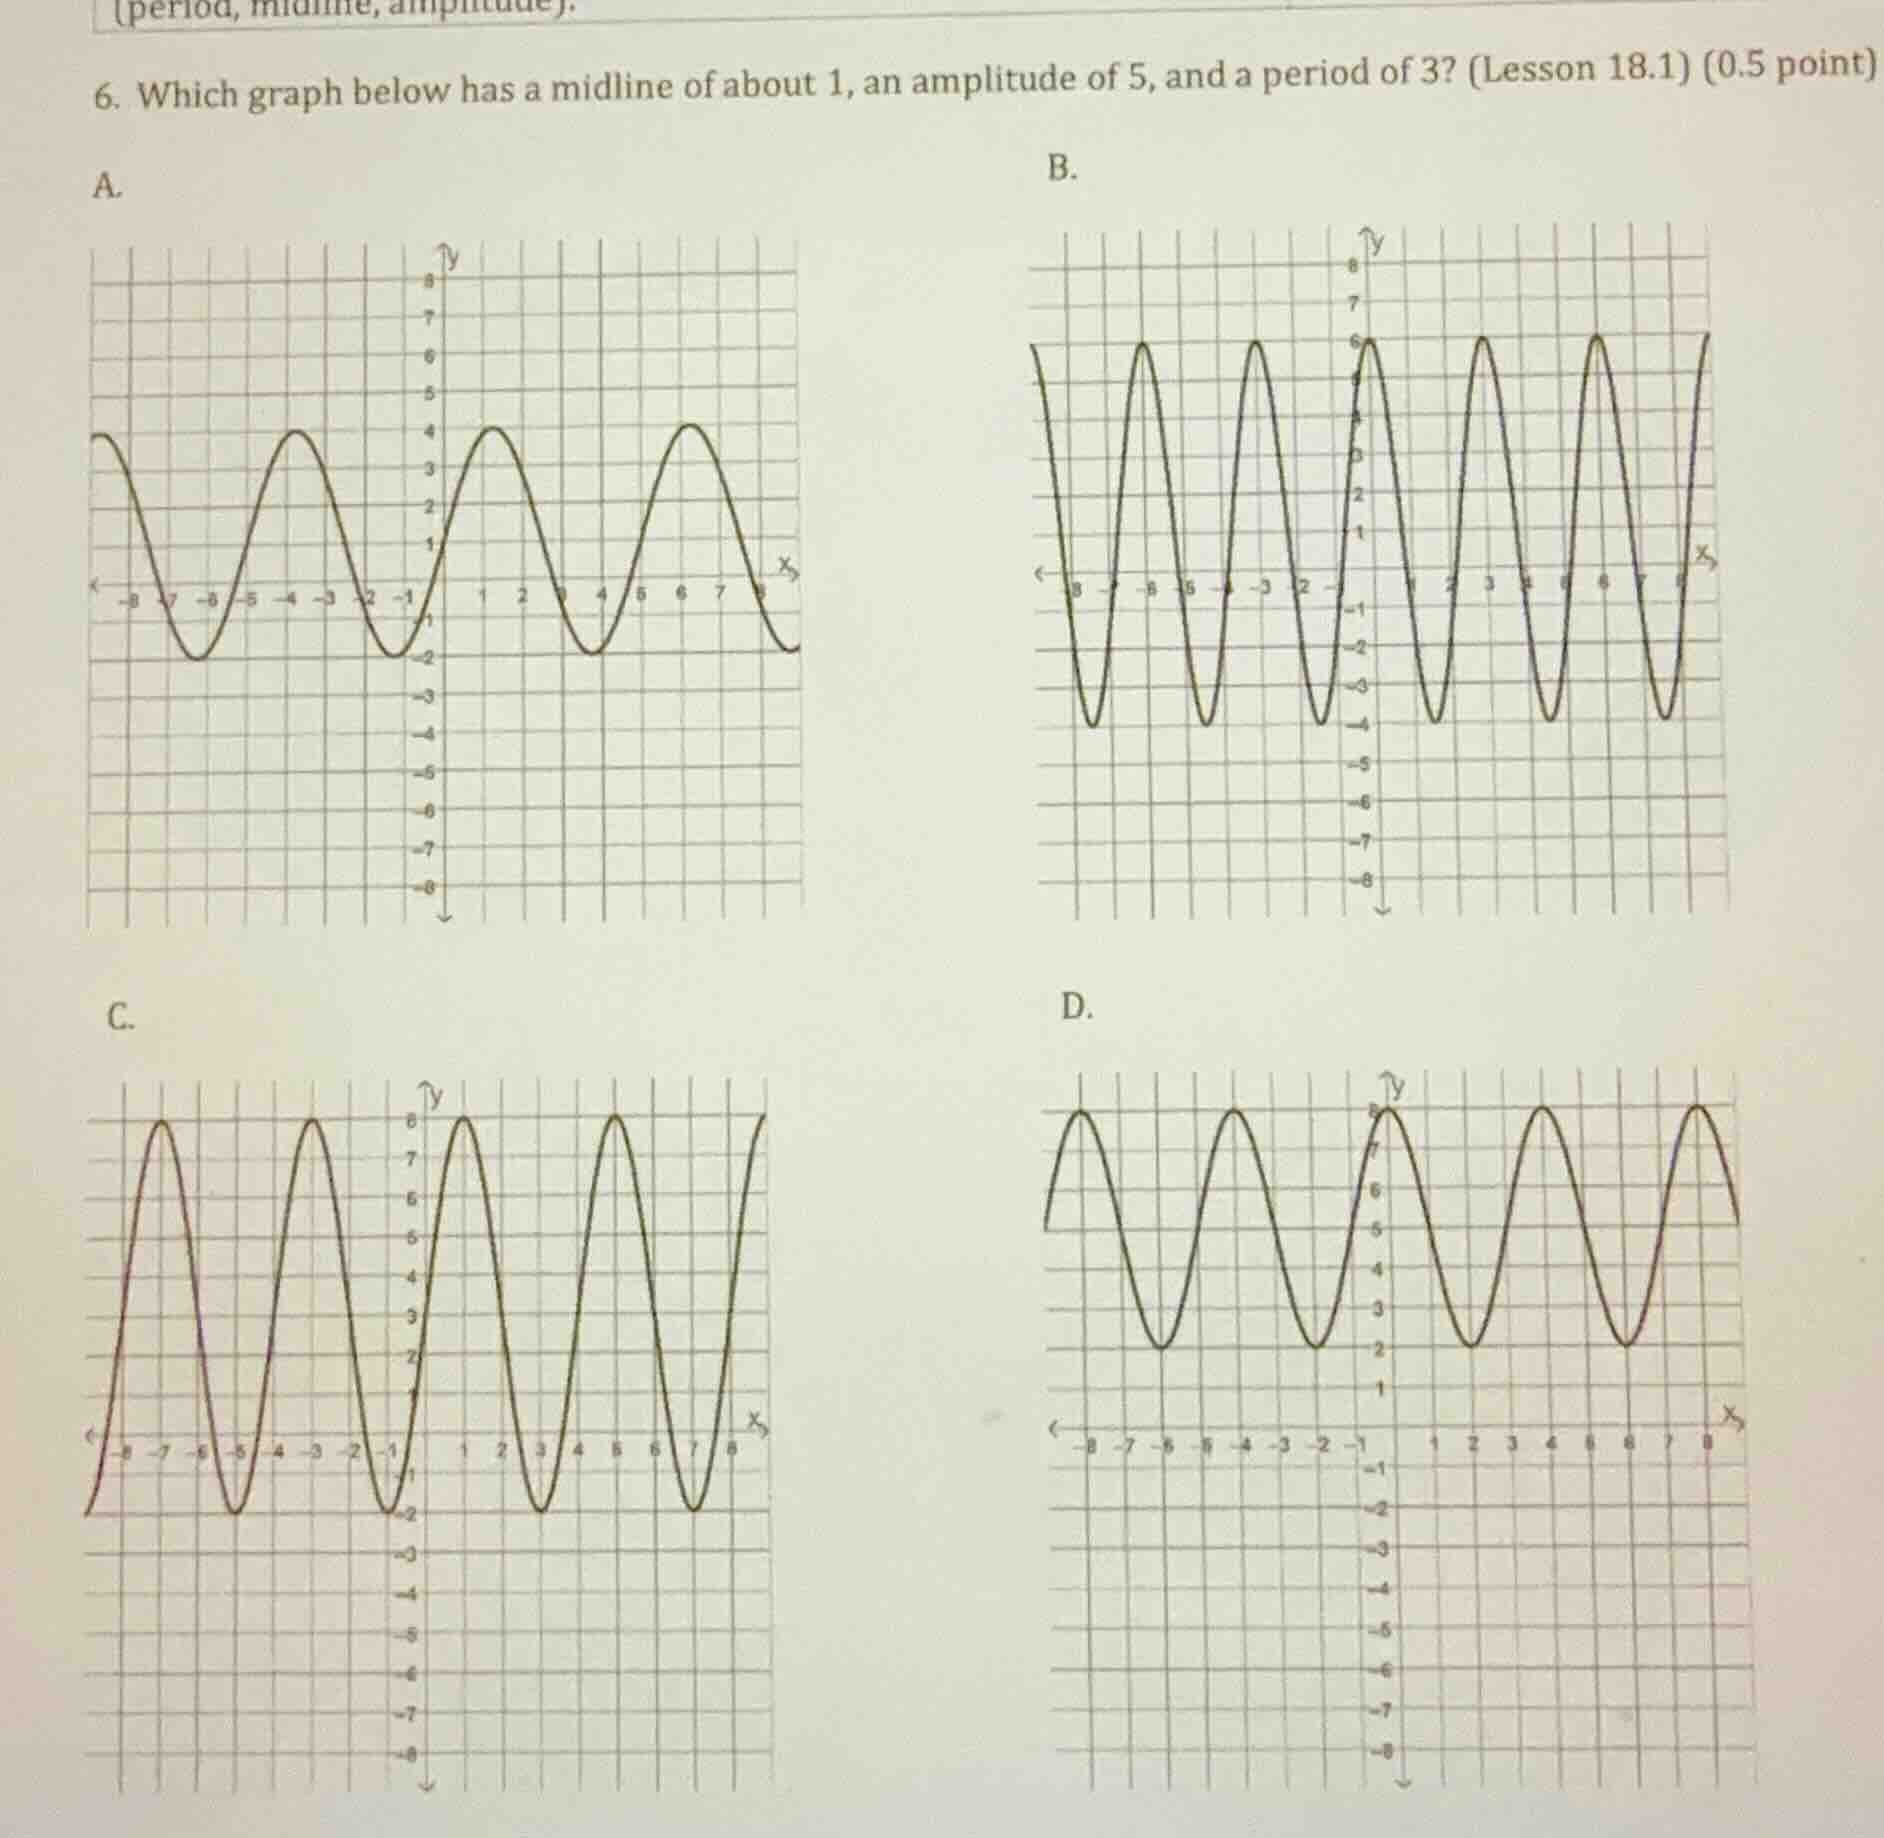
- which graph below has a midline of about 1, an amplitude of 5, and a period of 3? (lesson 18.1) (0.5 point) a. graph a b. graph b c. graph c d. graph d
Brief Explanations
- Midline Check: The midline is the horizontal line that the graph oscillates around. For a midline of \( y = 1 \), the distance from the midline to the maximum (or minimum) should be the amplitude. The amplitude is given as 5, so the maximum should be \( 1 + 5 = 6 \) and the minimum should be \( 1 - 5 = -4 \)? Wait, no, wait—wait, let's re - evaluate. Wait, maybe I made a mistake. Wait, the midline is the average of the maximum and minimum. So if midline \( M = 1 \), amplitude \( A = 5 \), then maximum \( = M+A=1 + 5=6 \), minimum \( = M - A=1-5=-4 \)? Wait, no, looking at the graphs:
- Let's check each graph:
- Graph A: The midline seems to be around \( y=-0.5 \) or so (since the peaks are around 4 and troughs around - 2, midline \( \frac{4+( - 2)}{2}=1 \)? Wait, peak at 4, trough at - 2. Midline \( \frac{4+( - 2)}{2}=1 \). Amplitude: distance from midline to peak: \( 4 - 1 = 3 \). Not 5. So A is out.
- Graph B: Let's see the peaks and troughs. The peak is at 6, trough at - 4. Midline \( \frac{6+( - 4)}{2}=\frac{2}{2}=1 \). Amplitude: \( 6 - 1 = 5 \). Now check the period. The period is the distance between two consecutive peaks (or troughs). Let's look at the x - axis. From one peak to the next, how many units? Let's see the grid. If we look at the peaks, from x = - 7 to x=-4? Wait, no, let's count the grid squares. Wait, the period should be 3. Let's check the distance between two consecutive peaks. In graph B, let's see the x - coordinates of peaks. If we take a peak at x=-7, next at x = - 4? Wait, no, the distance between x=-7 and x=-4 is 3 units? Wait, no, the grid lines: each square is 1 unit? Let's assume each grid square is 1 unit. So from one peak to the next, if it's 3 units, that's the period. Wait, but let's check the other graphs.
- Graph C: The midline: peaks around 8? No, wait, the peaks are around 8? No, the y - axis: the peak is at 8? Wait, no, the midline here: if the peak is at 8 and trough at - 2, midline \( \frac{8+( - 2)}{2}=3 \). Not 1. So C is out.
- Graph D: The peak is at 8, trough at 2. Midline \( \frac{8 + 2}{2}=5 \). Not 1. So D is out.
- Wait, wait, maybe I messed up Graph B. Wait, the peak is at 6, trough at - 4. Midline \( \frac{6+( - 4)}{2}=1 \). Amplitude \( 6 - 1 = 5 \). Now the period: let's check the distance between two consecutive troughs. The troughs: from x=-8 to x=-5? The distance is 3 units. So period is 3. So Graph B has midline 1, amplitude 5 (since \( 6 - 1 = 5 \) and \( 1-( - 4)=5 \)), and period 3.

Snap & solve any problem in the app
Get step-by-step solutions on Sovi AI
Photo-based solutions with guided steps
Explore more problems and detailed explanations
B. The graph with midline about 1, amplitude of 5, and period of 3