QUESTION IMAGE
Question
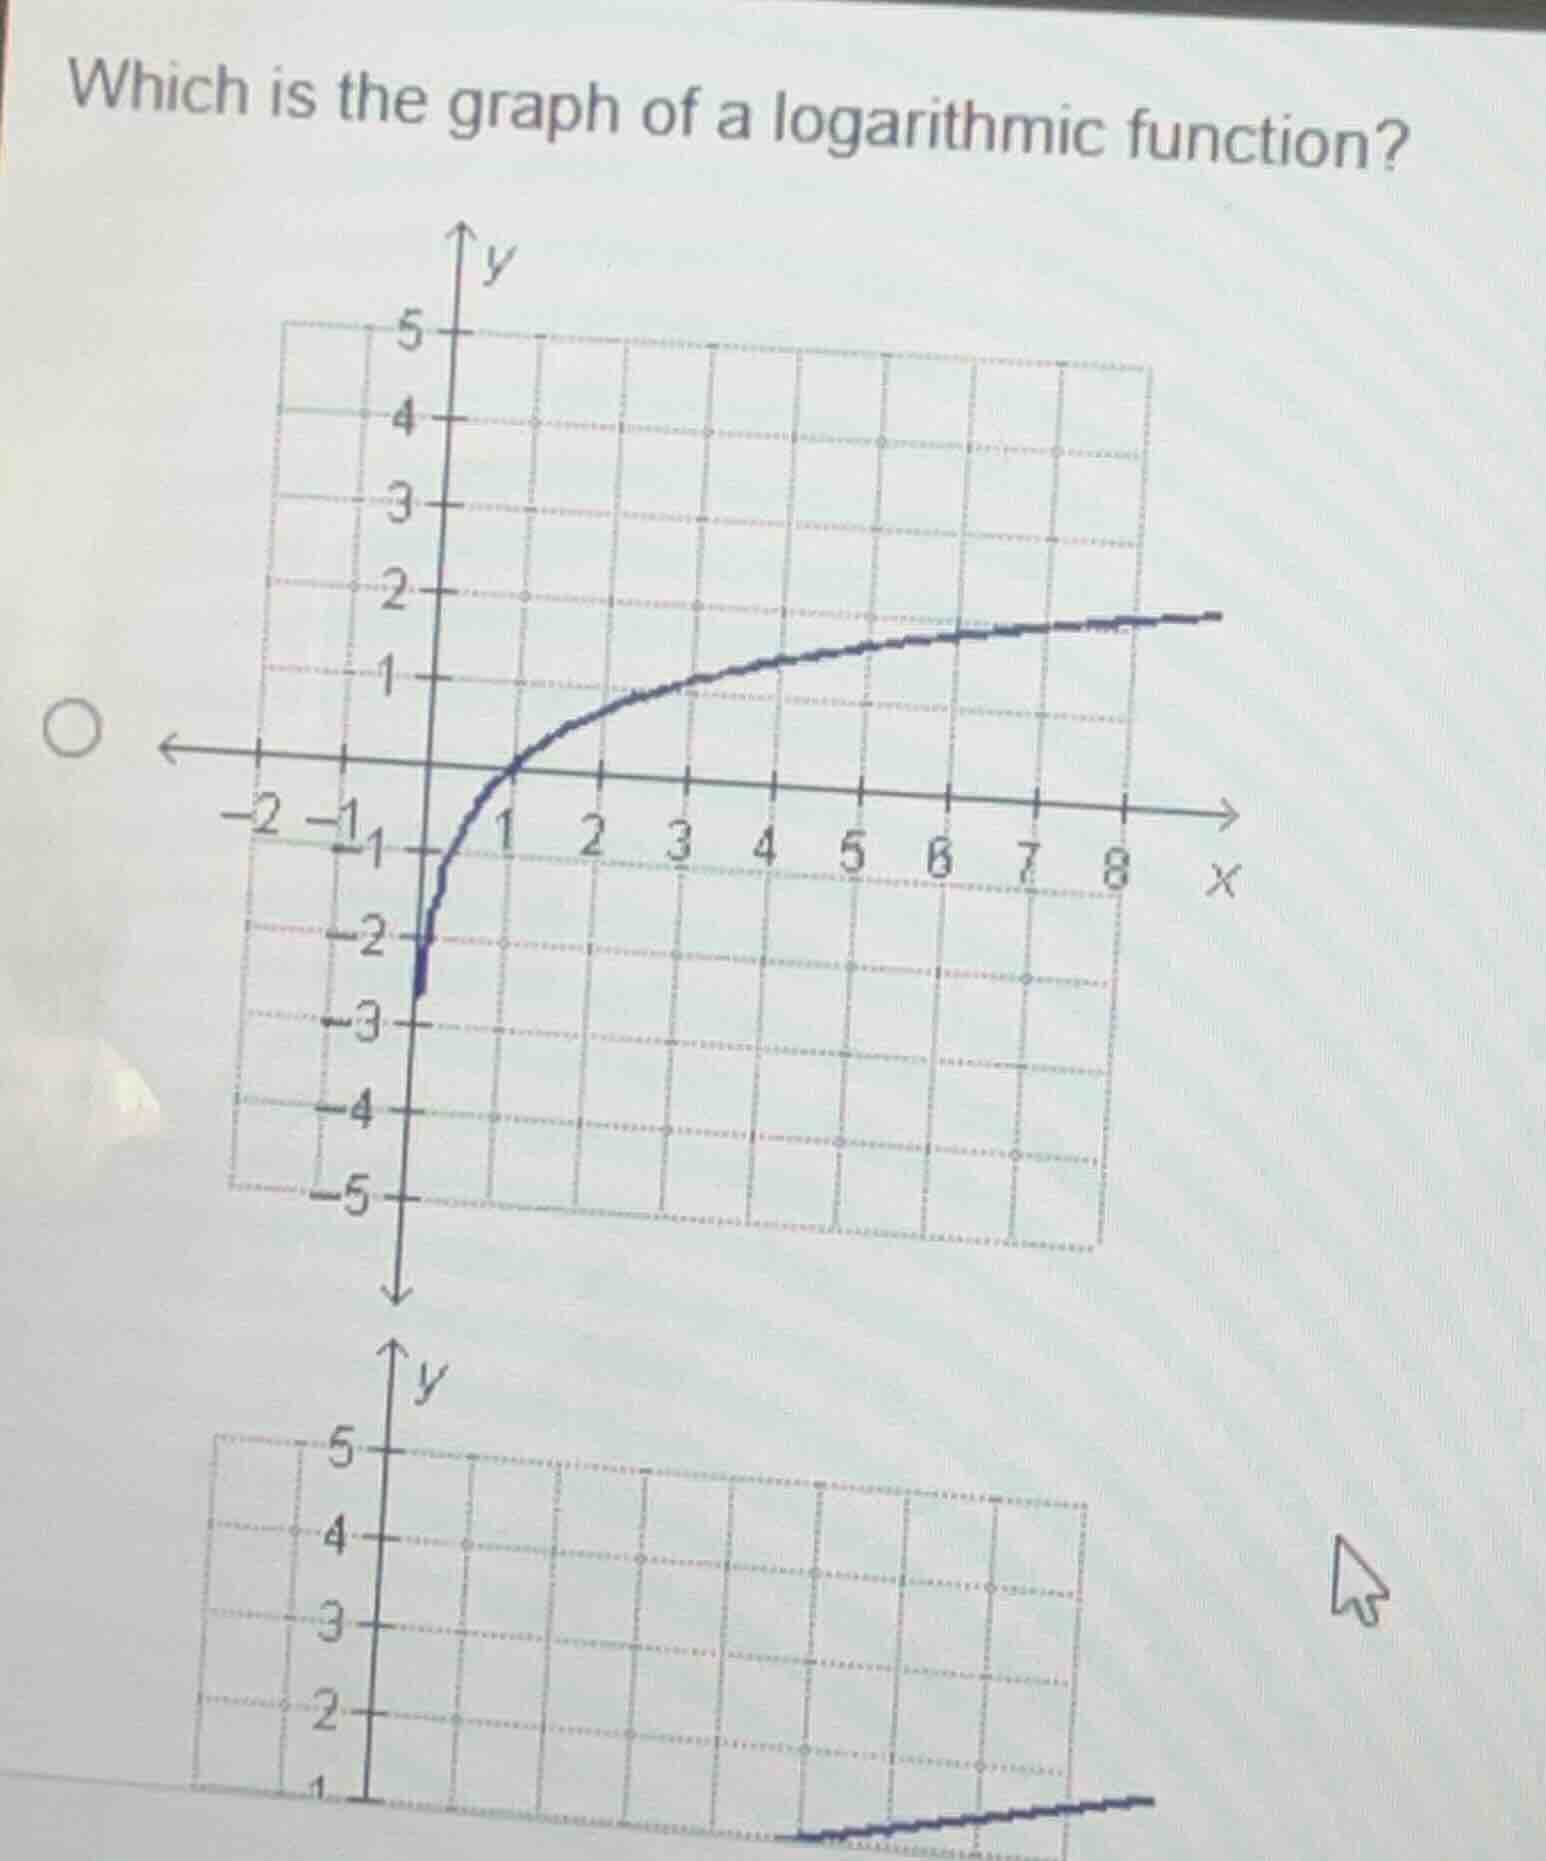
which is the graph of a logarithmic function?
Step1: Recall Logarithmic Function Properties
A logarithmic function \( y = \log_b(x) \) (where \( b>0, b
eq1 \)) has a domain of \( x > 0 \), a vertical asymptote at \( x = 0 \), and its graph increases (for \( b>1 \)) or decreases (for \( 0 < b < 1 \)) with a concave - down shape (for \( b>1 \)) as \( x \) increases. Also, when \( x = 1 \), \( y=\log_b(1)=0 \) for any valid base \( b \).
Step2: Analyze the Given Graphs
- For the first graph (the one with the curve starting near the \( y \) - axis and curving up):
- The domain of this function seems to include \( x = 0 \) (or values close to \( x = 0 \) on the left - hand side), which is not consistent with the domain of a logarithmic function (\( x>0 \)). Also, the shape of the curve looks more like a square - root or a transformed exponential function (maybe a function like \( y=\sqrt{x + c}\) or \( y = a^x + k\)) rather than a logarithmic function.
- For the second graph (assuming the typical logarithmic graph shape, even though the full graph is not shown completely):
- A logarithmic function should have a vertical asymptote at \( x = 0 \) (the \( y \) - axis for \( x>0 \) domain). The graph should be defined only for \( x>0 \), and as \( x \) approaches \( 0 \) from the right, \( y \) approaches \( -\infty \) (for \( b > 1 \)) or \(+\infty\) (for \( 0 < b<1 \)), and as \( x \) increases, it has a slow, increasing (or decreasing) concave - down (or concave - up) shape. If the second graph has a vertical asymptote at \( x = 0 \) (or near \( x = 0 \) for \( x>0 \)) and the correct domain and shape, it is the graph of a logarithmic function. (Since the first graph has a domain that includes \( x\leq0 \) which is not allowed for a basic logarithmic function, the second graph (the one with the curve that is defined for \( x > 0 \) and has the typical logarithmic - like shape) is the graph of a logarithmic function.

Snap & solve any problem in the app
Get step-by-step solutions on Sovi AI
Photo-based solutions with guided steps
Explore more problems and detailed explanations
The graph (the second one, assuming the standard logarithmic graph characteristics like domain \( x>0 \), vertical asymptote at \( x = 0 \), and the typical increasing/decreasing concave - shaped curve) is the graph of a logarithmic function. (If we consider the first graph shown, the second graph (the one with the curve that is defined for \( x>0 \) and has the shape consistent with a logarithmic function) is the correct one. Since the first graph has a domain that includes non - positive \( x \) values which is not valid for a logarithmic function \( y=\log_b(x) \) with \( x>0 \) as domain, the second graph (the one with the curve starting from near \( x = 0 \) (right - hand side) and having the appropriate shape) is the graph of a logarithmic function.)