QUESTION IMAGE
Question
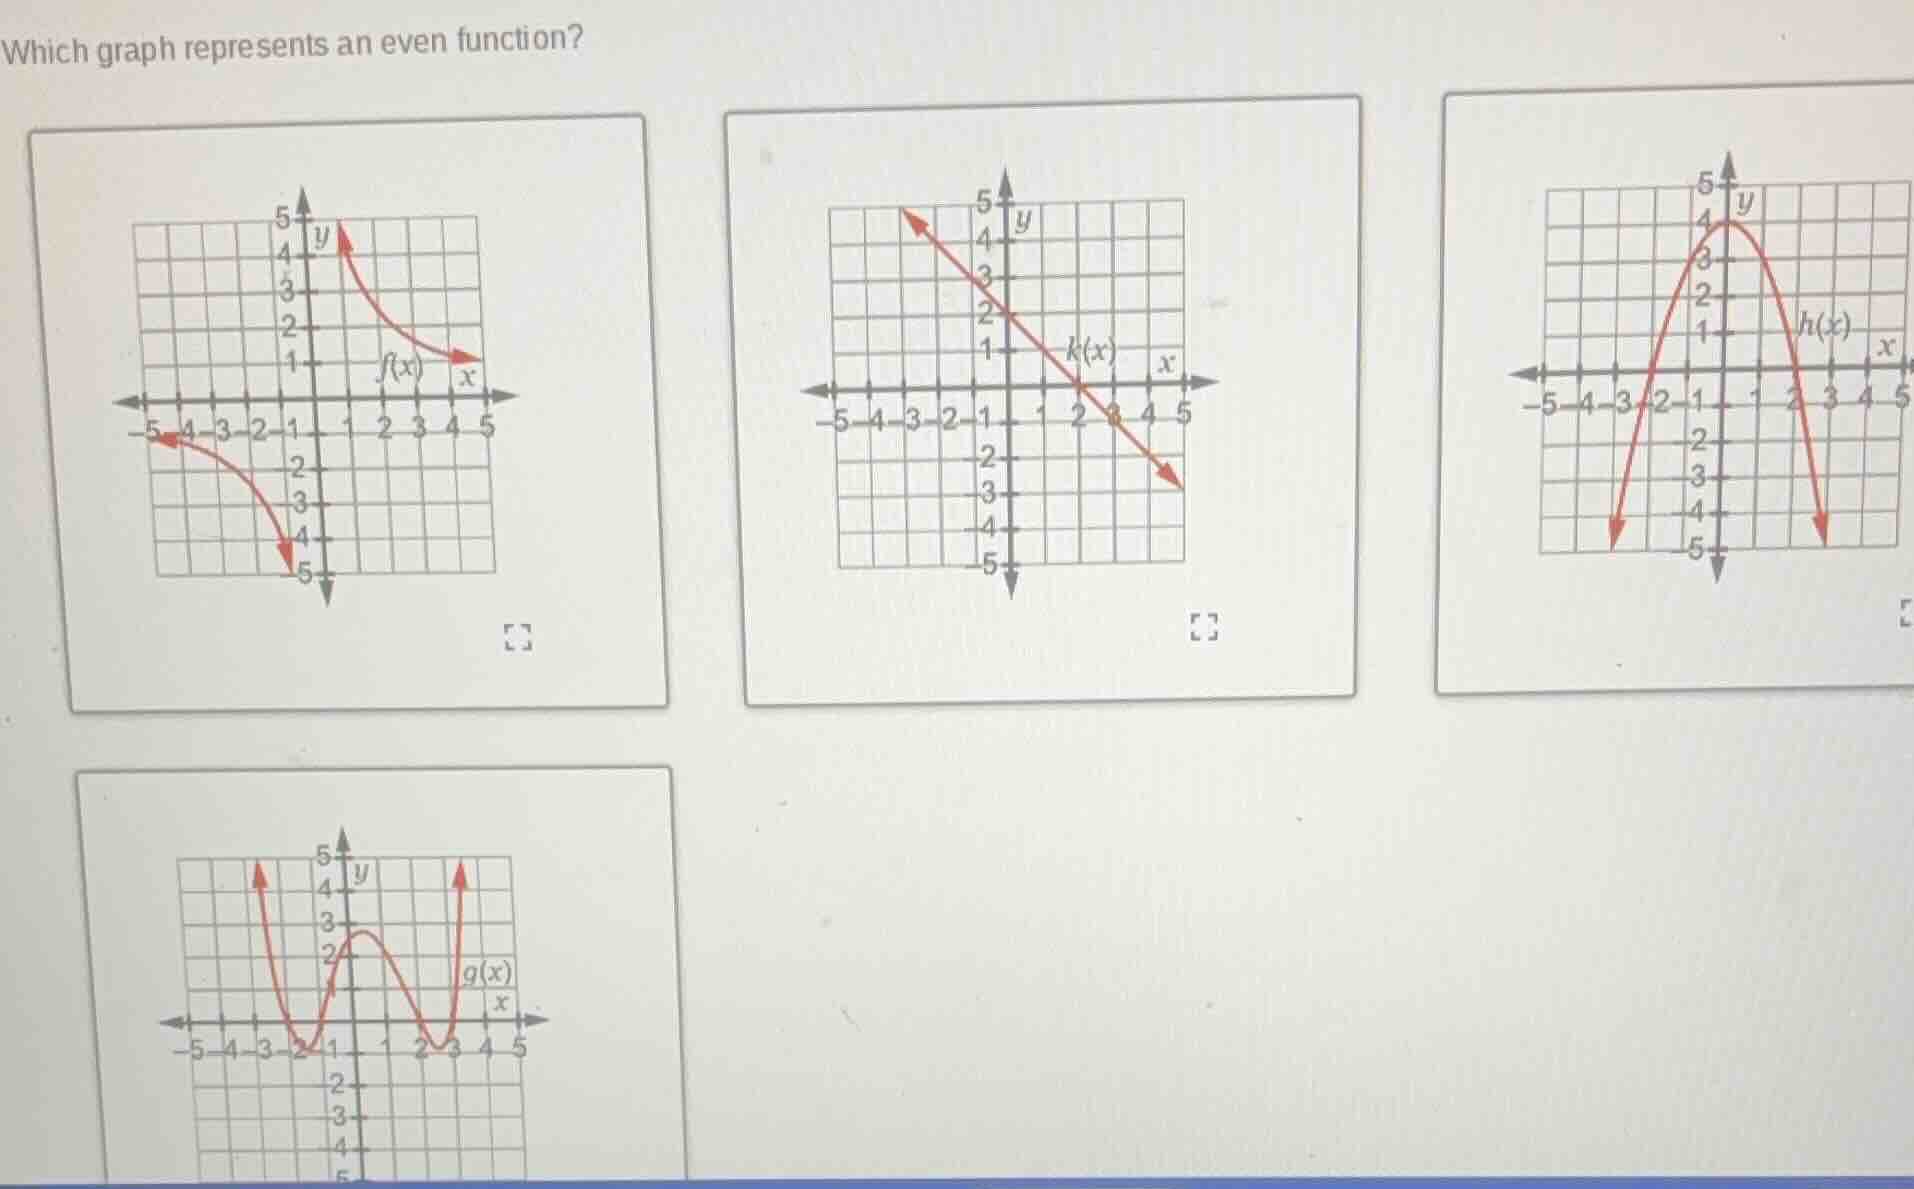
which graph represents an even function?
Step1: Recall the definition of an even function
An even function satisfies the property \( f(-x) = f(x) \) for all \( x \) in its domain. Geometrically, the graph of an even function is symmetric about the \( y \)-axis.
Step2: Analyze each graph
- First graph ( \( f(x) \)): The graph is symmetric about the origin (not the \( y \)-axis), so it is an odd function, not even.
- Second graph ( \( k(x) \)): This is a linear function with a slope, and its graph is a straight line. It is symmetric about a point (the midpoint between its \( x \)-intercept and \( y \)-intercept) but not about the \( y \)-axis, so it is not even.
- Third graph ( \( h(x) \)): The graph is a parabola opening downward, and it is symmetric about the \( y \)-axis. For any \( x \), \( h(-x) = h(x) \), so this satisfies the condition for an even function.
- Fourth graph ( \( g(x) \)): The graph is symmetric about the vertical line \( x = 0.5 \) (or some line not the \( y \)-axis), so it is not symmetric about the \( y \)-axis and thus not an even function.

Snap & solve any problem in the app
Get step-by-step solutions on Sovi AI
Photo-based solutions with guided steps
Explore more problems and detailed explanations
The graph of \( h(x) \) (the third graph, the downward - opening parabola symmetric about the \( y \)-axis) represents an even function.