QUESTION IMAGE
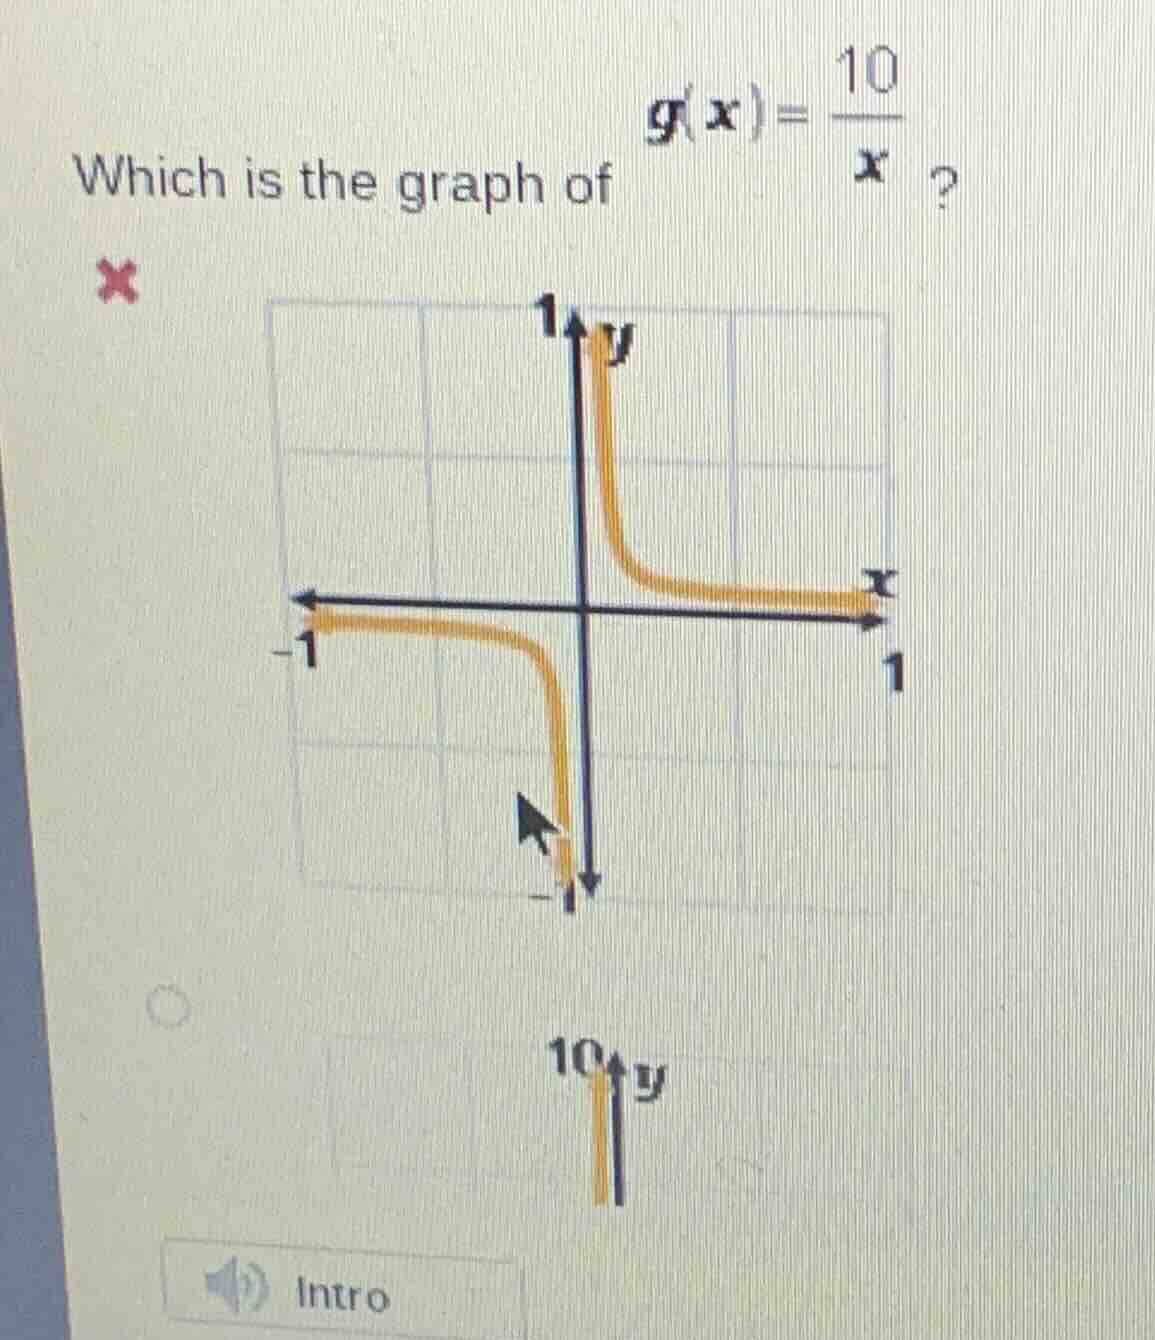
Question
which is the graph of $g(x)=\frac{10}{x}$? (there is an image of a coordinate plane with a graph and another option partially shown)
Step1: Recall the form of reciprocal function
The function \( g(x)=\frac{10}{x} \) is a reciprocal (rational) function of the form \( y = \frac{k}{x} \) where \( k = 10>0 \). For \( y=\frac{k}{x} \) with \( k>0 \), the graph has two branches: one in the first quadrant (where \( x>0,y>0 \)) and one in the third quadrant (where \( x<0,y<0 \)) because when \( x>0 \), \( y=\frac{10}{x}>0 \) and when \( x<0 \), \( y=\frac{10}{x}<0 \). Also, as \( |x| \) increases, \( |y| \) decreases, and as \( |x| \) approaches 0, \( |y| \) approaches infinity (vertical asymptote at \( x = 0 \), horizontal asymptote at \( y=0 \)).
Step2: Analyze the given incorrect graph
The first (incorrect) graph shown has a scale where the y - axis and x - axis range from - 1 to 1. But for \( g(x)=\frac{10}{x} \), when \( x = 1 \), \( y=10 \); when \( x = 10 \), \( y = 1 \); when \( x=- 1 \), \( y=-10 \); when \( x=-10 \), \( y=-1 \). So the graph should have branches that are in the first and third quadrants, and the points on the graph should satisfy \( xy = 10 \). The correct graph will have a larger scale (since \( k = 10 \)) compared to the graph of \( y=\frac{1}{x} \), with the two hyperbolic branches in the first and third quadrants, approaching the x - axis (horizontal asymptote) as \( x
ightarrow\pm\infty \) and approaching the y - axis (vertical asymptote) as \( x
ightarrow0^{\pm} \).
(Note: Since the full set of options is not completely visible, but based on the function \( y = \frac{10}{x} \), the correct graph will be a hyperbola with two branches: one in the first quadrant (where \( x>0,y>0 \)) and one in the third quadrant (where \( x<0,y<0 \)), with the general shape of \( y=\frac{k}{x} \) for \( k>0 \), and with points like \( (1,10) \), \( (2,5) \), \( (5,2) \), \( (10,1) \) on the first - quadrant branch and \( (- 1,-10) \), \( (-2,-5) \), \( (-5,-2) \), \( (-10,-1) \) on the third - quadrant branch.)

Snap & solve any problem in the app
Get step-by-step solutions on Sovi AI
Photo-based solutions with guided steps
Explore more problems and detailed explanations
The graph of \( g(x)=\frac{10}{x} \) is a hyperbola with two branches: one in the first quadrant (where \( x > 0,y>0 \)) and one in the third quadrant (where \( x<0,y < 0 \)), with vertical asymptote \( x = 0 \) and horizontal asymptote \( y = 0 \), and passing through points like \( (1,10) \), \( (-1,-10) \), \( (2,5) \), \( (-2,-5) \) etc. (The correct graph will have a larger scale than the incorrect one shown, with branches in the first and third quadrants.)