QUESTION IMAGE
Question
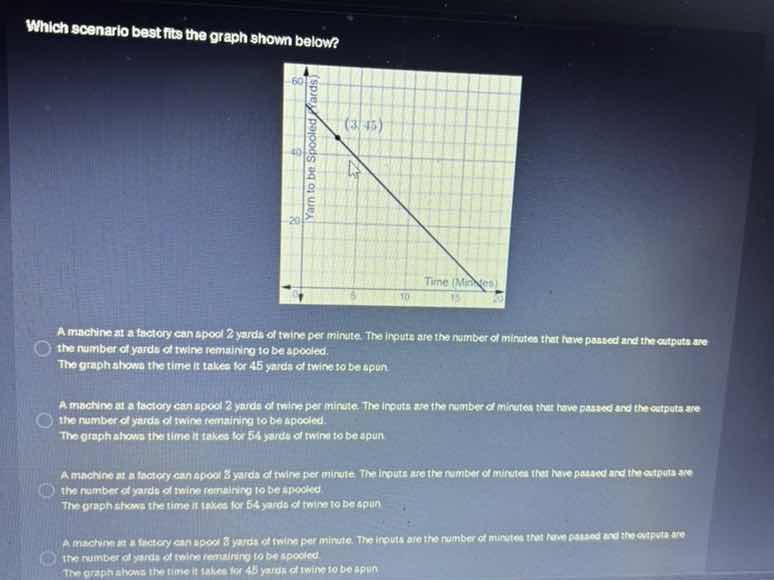
which scenario best fits the graph shown below? a machine at a factory can spool 2 yards of twine per minute. the inputs are the number of minutes that have passed and the outputs are the number of yards of twine remaining to be spooled. the graph shows the time it takes for 45 yards of twine to be spun. a machine at a factory can spool 2 yards of twine per minute. the inputs are the number of minutes that have passed and the outputs are the number of yards of twine remaining to be spooled. the graph shows the time it takes for 54 yards of twine to be spun a machine at a factory can spool 3 yards of twine per minute. the inputs are the number of minutes that have passed and the outputs are the number of yards of twine remaining to be spooled. the graph shows the time it takes for 54 yards of twine to be spun a machine at a factory can spool 3 yards of twine per minute. the inputs are the number of minutes that have passed and the outputs are the number of yards of twine remaining to be spooled. the graph shows the time it takes for 45 yards of twine to be spun
Step1: Find initial total yarn
The y-intercept is the starting yarn. At time=0, yarn=60 yards.
Step2: Calculate spooling rate
Use point (3,45). Yarn used: $60-45=15$ yards over 3 mins. Rate: $\frac{15}{3}=5$ yards/min.
Step3: Match to scenario
Check options: rate=5 yd/min, total=60 yd, output=remaining yarn.

Snap & solve any problem in the app
Get step-by-step solutions on Sovi AI
Photo-based solutions with guided steps
Explore more problems and detailed explanations
A machine at a factory can spool 5 yards of twine per minute. The inputs are the number of minutes that have passed and the outputs are the number of yards of twine remaining to be spooled.
The graph shows the time it takes for 60 yards of twine to be spun.