QUESTION IMAGE
Question
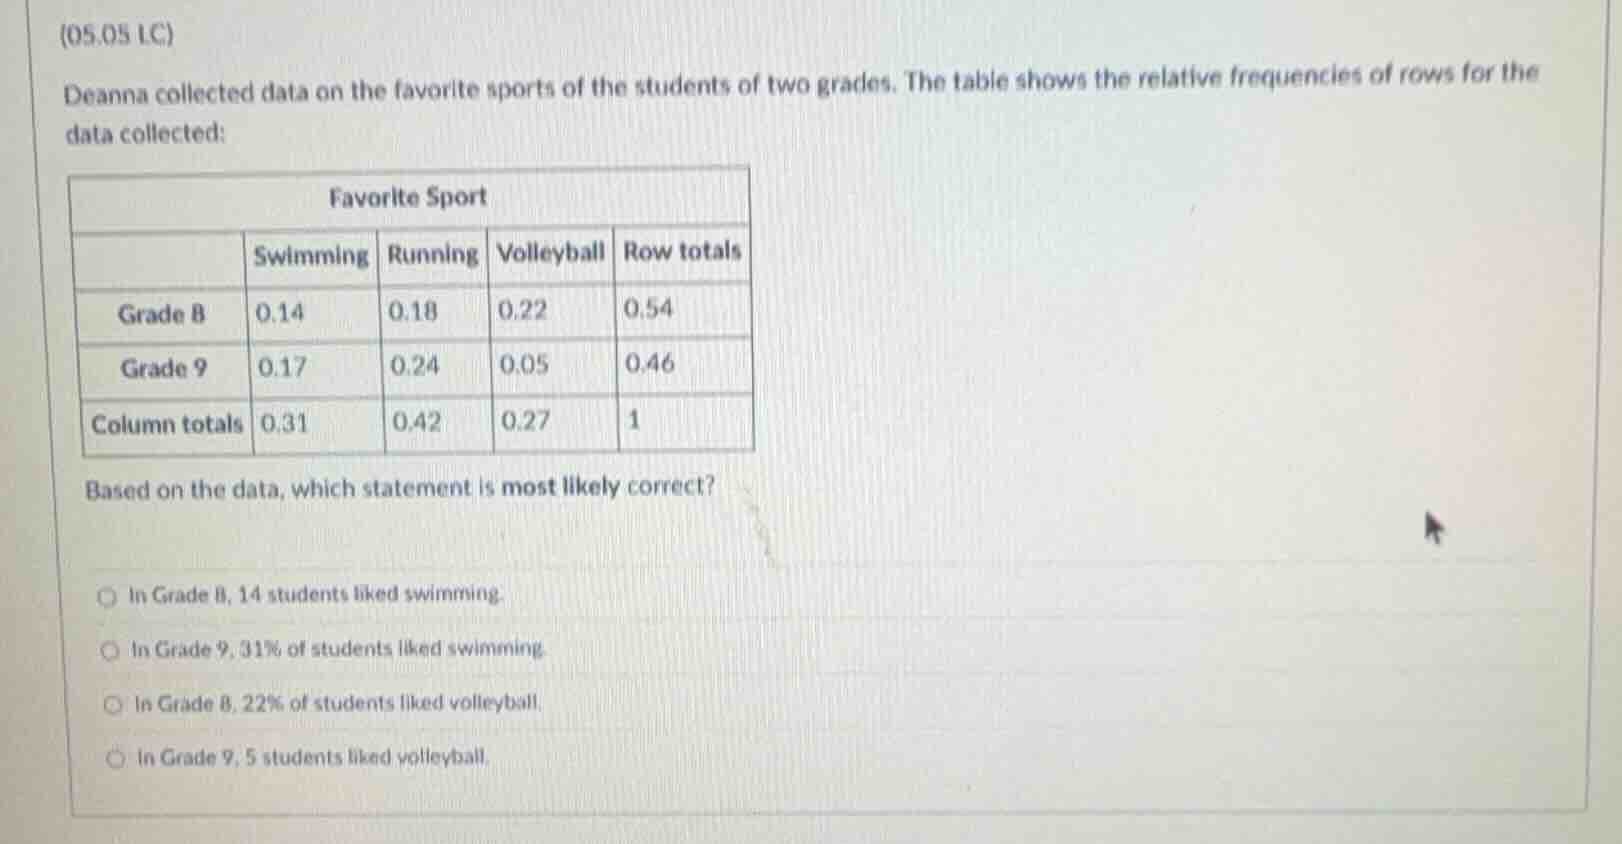
(05.05 lc)
deanna collected data on the favorite sports of the students of two grades. the table shows the relative frequencies of rows for the data collected:
based on the data, which statement is most likely correct?
○ in grade 8, 14 students liked swimming.
○ in grade 9, 31% of students liked swimming.
○ in grade 8, 22% of students liked volleyball.
○ in grade 9, 5 students liked volleyball.
Brief Explanations
- Analyze Option 1: The value 0.14 is a relative frequency (14% of Grade 8 students), not a raw count of 14 students. We don't know the total number of Grade 8 students, so this is incorrect.
- Analyze Option 2: 0.31 (31%) is the column total for swimming, representing 31% of all students (not just Grade 9). The relative frequency of Grade 9 students who like swimming is 0.17 (17%), so this is incorrect.
- Analyze Option 3: The table shows a row relative frequency of 0.22 (22%) for Grade 8 students who like volleyball. This means 22% of Grade 8 students chose volleyball as their favorite sport, which matches the statement.
- Analyze Option 4: The value 0.05 is a relative frequency (5% of Grade 9 students), not a raw count of 5 students. We don't know the total number of Grade 9 students, so this is incorrect.

Snap & solve any problem in the app
Get step-by-step solutions on Sovi AI
Photo-based solutions with guided steps
Explore more problems and detailed explanations
C. In Grade 8, 22% of students liked volleyball.