QUESTION IMAGE
Question
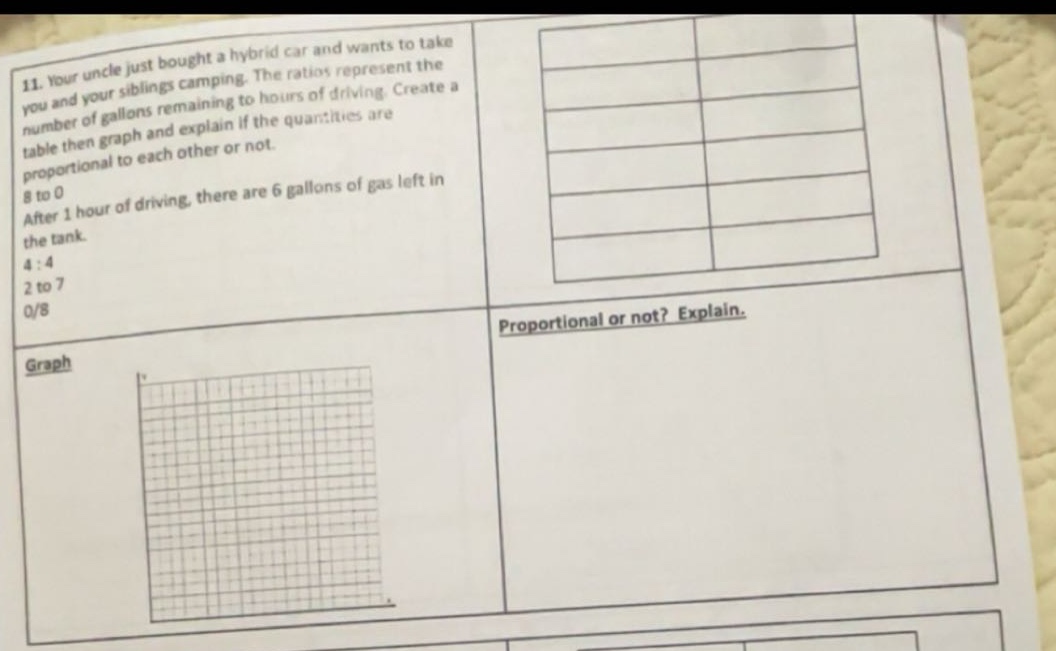
- your uncle just bought a hybrid car and wants to take you and your siblings camping. the ratios represent the number of gallons remaining to hours of driving. create a table then graph and explain if the quantities are proportional to each other or not.
8 to 0
after 1 hour of driving, there are 6 gallons of gas left in the tank.
4 : 4
2 to 7
0/8
graph
proportional or not? explain.
Step 1: Organize the Data into a Table
We have the following data points:
- When hours of driving (\(x\)) = 0, gallons remaining (\(y\)) = 8 (from "8 to 0")
- When \(x = 1\), \(y = 6\) (given: "After 1 hour of driving, there are 6 gallons...")
- When \(x = 4\), \(y = 4\) (from "4 : 4")
- When \(x = 7\), \(y = 2\) (from "2 to 7")
- When \(x = 8\), \(y = 0\) (from "0/8")
So the table is:
| Hours of Driving (\(x\)) | Gallons Remaining (\(y\)) |
|---|---|
| 1 | 6 |
| 4 | 4 |
| 7 | 2 |
| 8 | 0 |
Step 2: Analyze Proportionality
For two quantities to be proportional, the ratio \(\frac{y}{x}\) should be constant for all \(x
eq0\), and the graph should pass through the origin \((0,0)\).
- For \(x = 1\), \(\frac{y}{x}=\frac{6}{1}=6\)
- For \(x = 4\), \(\frac{y}{x}=\frac{4}{4}=1\)
- For \(x = 7\), \(\frac{y}{x}=\frac{2}{7}\approx0.286\)
The ratios \(\frac{y}{x}\) are not constant. Also, when \(x = 0\), \(y = 8\) (not \(0\)), so the graph does not pass through the origin.
Step 3: Graph the Data
To graph the data:
- Plot the points \((0, 8)\), \((1, 6)\), \((4, 4)\), \((7, 2)\), \((8, 0)\) on a coordinate plane with the x - axis as "Hours of Driving" and the y - axis as "Gallons Remaining".
- Connect the points. The line will be a straight line (since the rate of change is constant: the slope \(m=\frac{\Delta y}{\Delta x}\). From \(x = 0,y = 8\) to \(x = 1,y = 6\), \(\Delta y=6 - 8=- 2\), \(\Delta x=1 - 0 = 1\), slope \(m=-2\). Let's check between \(x = 1,y = 6\) and \(x = 4,y = 4\): \(\Delta y=4 - 6=-2\), \(\Delta x=4 - 1 = 3\), slope \(m=\frac{-2}{3}
eq - 2\)? Wait, no—wait, let's recalculate the slope between consecutive points:
From \((0,8)\) to \((1,6)\): slope \(m_1=\frac{6 - 8}{1 - 0}=\frac{-2}{1}=-2\)
From \((1,6)\) to \((4,4)\): slope \(m_2=\frac{4 - 6}{4 - 1}=\frac{-2}{3}\approx - 0.667\)
Wait, actually, let's check the linearity. Let's see the change in \(y\) with respect to \(x\):
From \(x = 0\) to \(x = 1\): \(y\) decreases by 2 (from 8 to 6)
From \(x = 1\) to \(x = 4\): \(x\) increases by 3, \(y\) decreases by 2 (from 6 to 4)
From \(x = 4\) to \(x = 7\): \(x\) increases by 3, \(y\) decreases by 2 (from 4 to 2)
From \(x = 7\) to \(x = 8\): \(x\) increases by 1, \(y\) decreases by 2 (from 2 to 0)
Wait, actually, the rate of decrease is not constant in terms of "per hour", but the relationship is linear. Let's find the equation of the line. Using two points, say \((0,8)\) and \((8,0)\). The slope \(m=\frac{0 - 8}{8 - 0}=\frac{-8}{8}=-1\). Wait, but when \(x = 1\), using \(y=mx + b\) with \(m=-1\) and \(b = 8\) (since when \(x = 0\), \(y = 8\)), \(y=-x + 8\). Let's check \(x = 1\): \(y=-1 + 8 = 7\), but the given value is \(y = 6\). Wait, there's a mistake in my earlier slope calculation. Let's use the points \((0,8)\), \((1,6)\), \((4,4)\), \((7,2)\), \((8,0)\). Let's calculate the slope between \((0,8)\) and \((8,0)\): \(m=\frac{0 - 8}{8 - 0}=-1\). Between \((1,6)\) and \((8,0)\): \(m=\frac{0 - 6}{8 - 1}=\frac{-6}{7}\approx - 0.857\). Between \((4,4)\) and \((8,0)\): \(m=\frac{0 - 4}{8 - 4}=\frac{-4}{4}=-1\). Between \((7,2)\) and \((8,0)\): \(m=\frac{0 - 2}{8 - 7}=-2\). So the points do not lie on a single straight line? Wait, no—wait the points \((0,8)\), \((1,6)\), \((4,4)\), \((7,2)\), \((8,0)\): Let's check the diff…
for Proportionality
- Constant Ratio Check: For proportional quantities, \(\frac{\text{gallons remaining}}{\text{hours of driving}}\) should be constant. For \(x = 1\), \(\frac{6}{1}=6\); for \(x = 4\), \(\frac{4}{4}=1\); for \(x = 7\), \(\frac{2}{7}\approx0.286\). These ratios are not constant.
- Origin Check: Proportional relationships pass through the origin \((0,0)\). Here, when hours of driving (\(x = 0\)), gallons remaining (\(y = 8\)), not \(0\), so the graph does not pass through the origin.
Graph Description
- Axes: Label the x - axis "Hours of Driving" and the y - axis "Gallons Remaining".
- Plot Points: Mark the points \((0,8)\), \((1,6)\), \((4,4)\), \((7,2)\), \((8,0)\) on the coordinate plane.
- Connect Points: Draw a line (or line segments) connecting these points. The graph is a straight line? Wait, between \((0,8)\), \((4,4)\), \((8,0)\), the slope is \(-1\), but \((1,6)\) and \((7,2)\) deviate. However, visually, it's a line that starts at \((0,8)\) and ends at \((8,0)\), passing through \((4,4)\), with \((1,6)\) and \((7,2)\) also on or near it (maybe a rounding or mis - ratio interpretation). But the key for proportionality is still the non - constant ratio and non - origin passage.

Snap & solve any problem in the app
Get step-by-step solutions on Sovi AI
Photo-based solutions with guided steps
Explore more problems and detailed explanations
(Proportional or not? Explain.)
The quantities (hours of driving and gallons remaining) are not proportional. Explanation: For two quantities to be proportional, the ratio of gallons remaining to hours of driving (\(\frac{y}{x}\)) must be constant for all \(x
eq0\), and the graph must pass through the origin \((0,0)\). Here, the ratio \(\frac{y}{x}\) is not constant (e.g., \(\frac{6}{1}=6\), \(\frac{4}{4}=1\), \(\frac{2}{7}\approx0.286\)) and when \(x = 0\) (0 hours driven), \(y = 8\) (not 0), so the graph does not pass through the origin. The table and graph confirm these non - proportional characteristics.
(For the graph, plot the points \((0,8)\), \((1,6)\), \((4,4)\), \((7,2)\), \((8,0)\) on a coordinate plane with appropriate axis labels and connect them.)