QUESTION IMAGE
Question
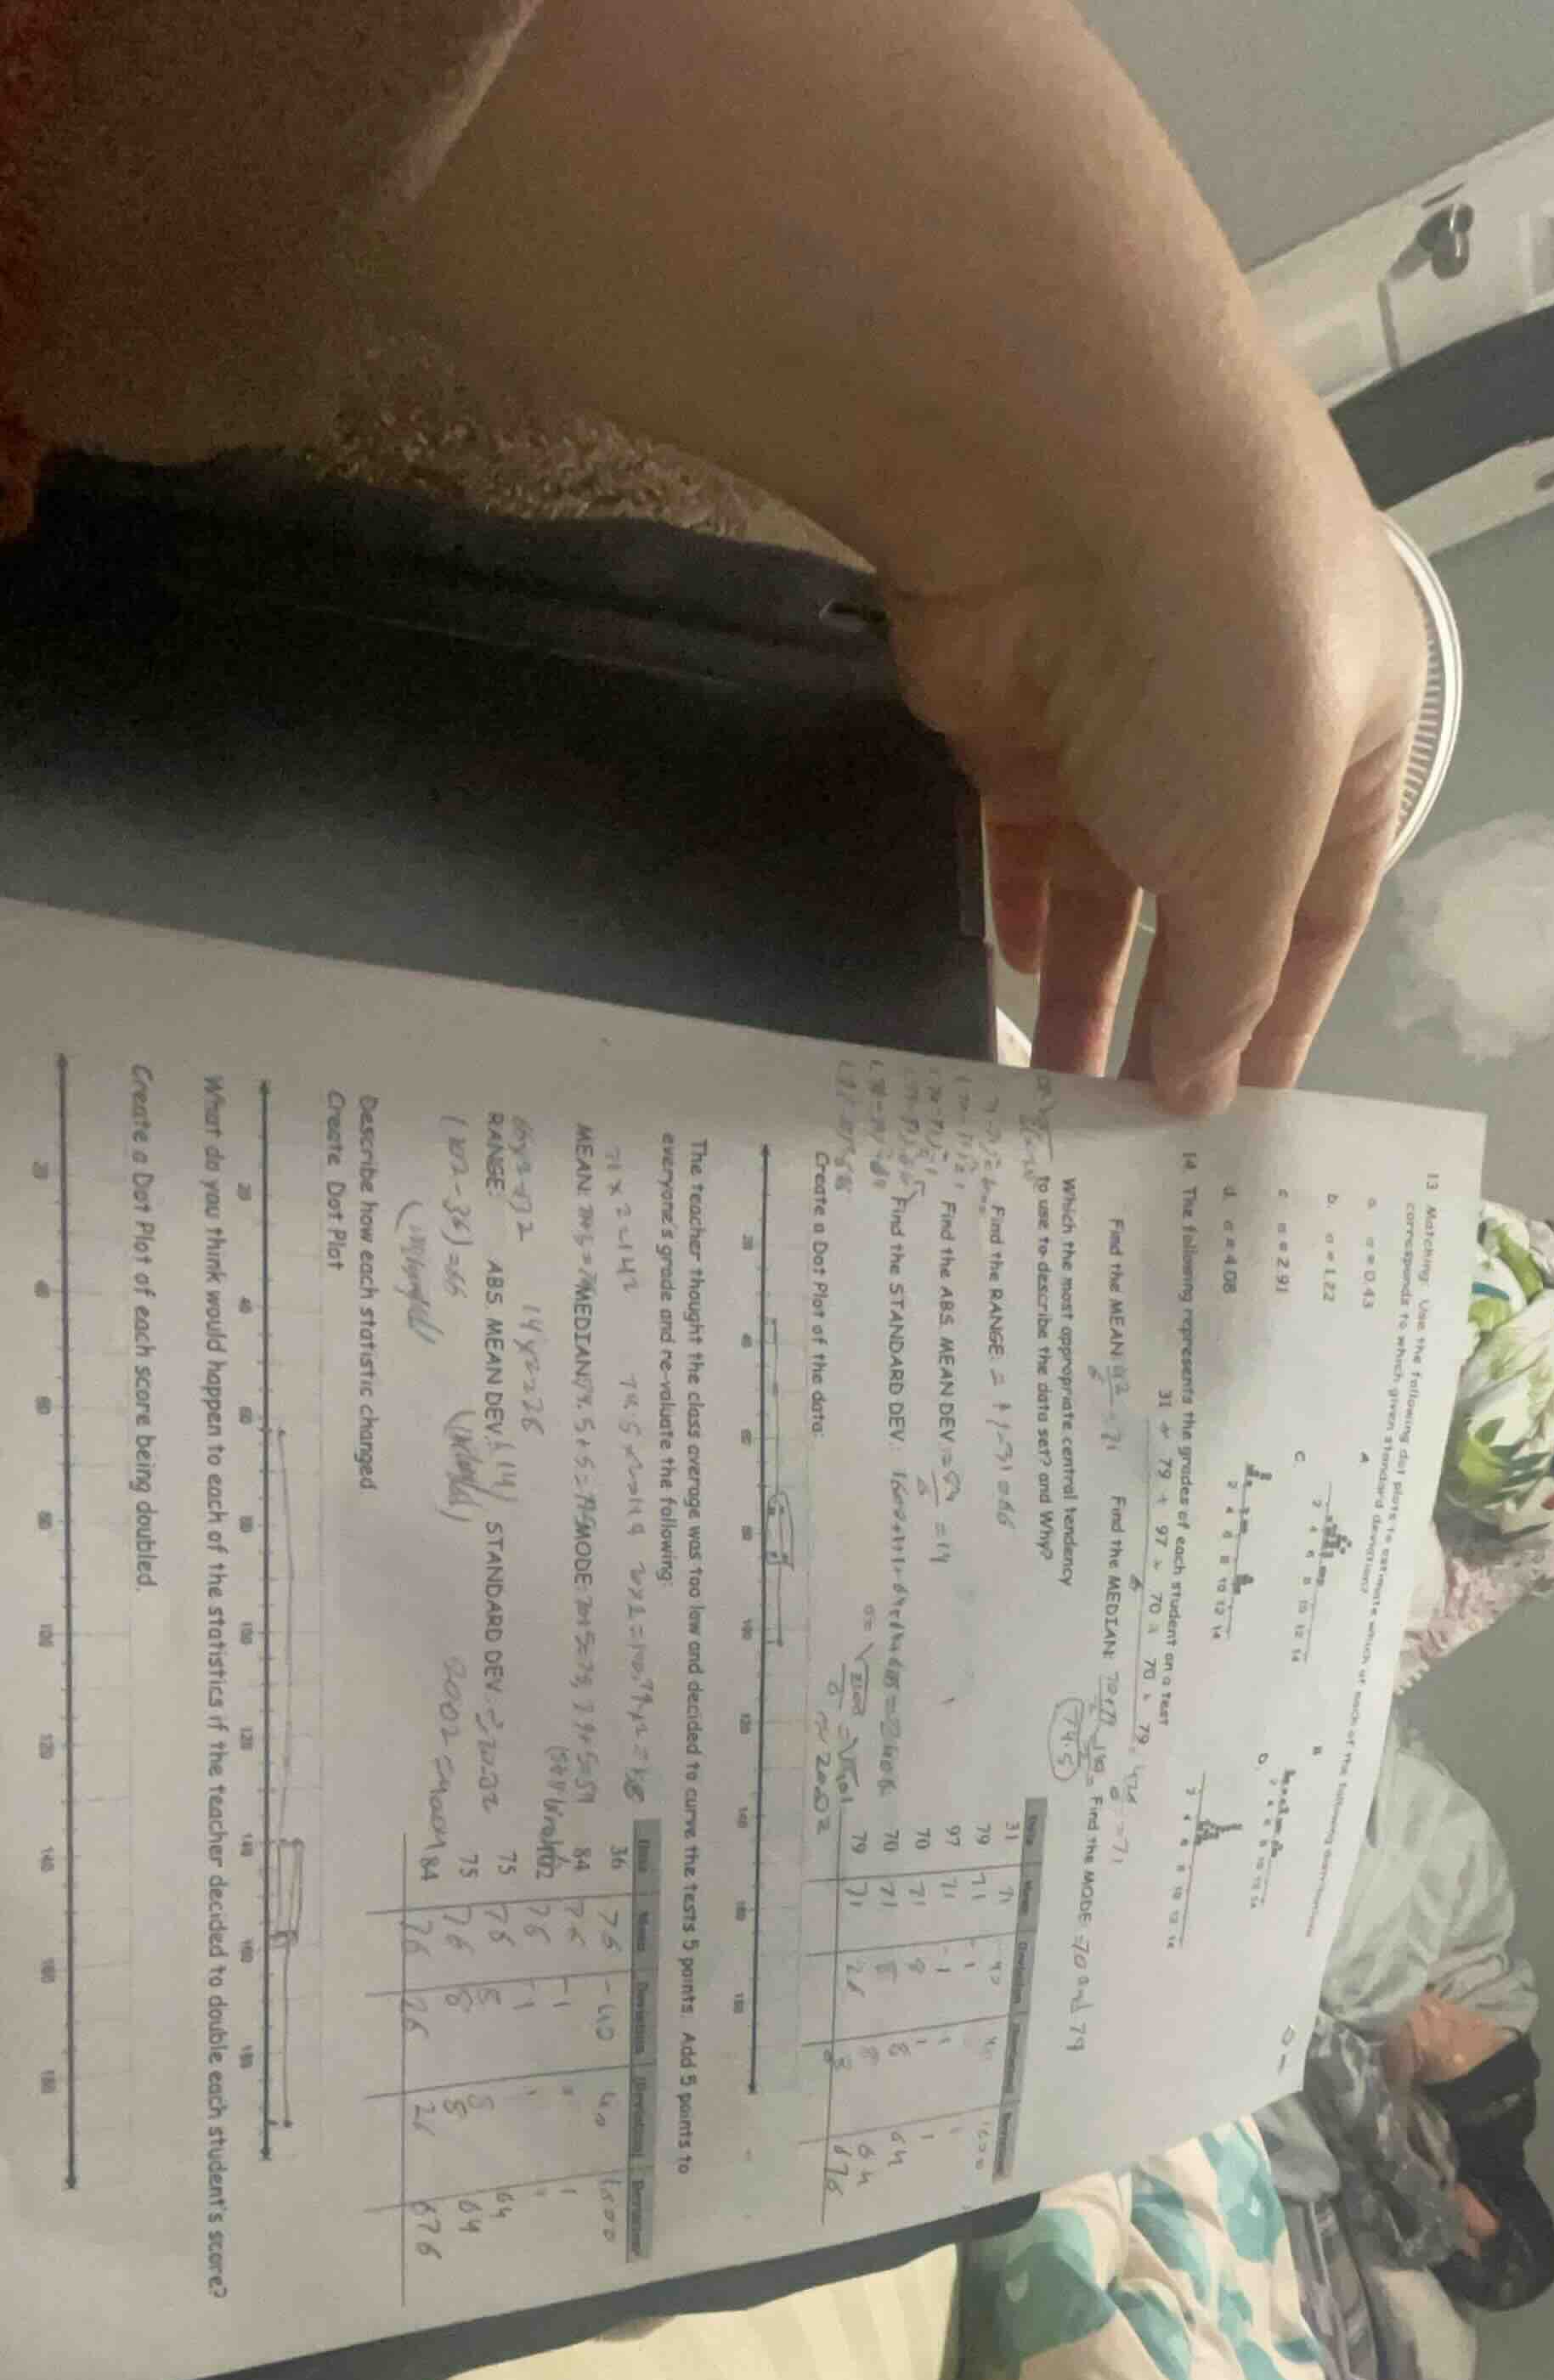
13 matching: use the following dot plots to determine which of the following dot plots corresponds to which given standard deviation. a. s = 0.43 b. s = 1.22 c. s = 2.91 d. s = 4.08 14. the following represents the grades of each student on a test: 31, 79, 97, 70, 70, 79. find the mean. find the median. find the mode. which the most appropriate central tendency to use to describe the data set? and why? find the range. find the abs. mean dev. find the standard dev. create a dot plot of the data. the teacher thought the class average was too low and decided to curve the tests 5 points: add 5 points to everyone’s grade and re - evaluate the following: mean, median, mode, range, abs. mean dev, standard dev. describe how each statistic changed. create a dot plot. what do you think would happen to each of the statistics if the teacher decided to double each student’s score? create a dot plot of each score being doubled.
To solve the problem of analyzing the effect of doubling scores on statistics (mean, median, mode, range, mean deviation, standard deviation), we follow these steps:
Step 1: Recall the original data
The original scores are: \( 31, 79, 97, 70, 70, 79 \) (wait, let's check the data again. From the paper, the scores seem to be \( 31, 79, 97, 70, 70, 79 \)? Wait, maybe the original data is \( 31, 79, 97, 70, 70, 79 \)? Wait, let's list the original scores properly. Let's assume the original scores are \( 31, 79, 97, 70, 70, 79 \) (maybe with some duplicates). Wait, actually, looking at the paper, the scores are: \( 31, 79, 97, 70, 70, 79 \) (let's confirm: the data points are 31, 79, 97, 70, 70, 79? Wait, maybe the original data is \( 31, 79, 97, 70, 70, 79 \). Let's compute the original statistics first, then see the effect of doubling.
Step 2: Effect of doubling scores on each statistic
Let the original score be \( x \), new score be \( 2x \).
Mean:
Original mean: \( \bar{x} = \frac{\sum x}{n} \)
New mean: \( \bar{x}' = \frac{\sum (2x)}{n} = 2 \cdot \frac{\sum x}{n} = 2\bar{x} \)
So mean doubles.
Median:
Median is the middle value (or average of two middle values). If we double each score, the order of scores remains the same (since doubling is a monotonic transformation). So the new median is \( 2 \times \) original median.
Mode:
Mode is the most frequent value. Doubling each score will double the mode (since the most frequent value, when doubled, becomes the new most frequent value with the same frequency).
Range:
Range = Max - Min
New range = \( 2 \times \) Max - \( 2 \times \) Min = \( 2(Max - Min) = 2 \times \) original range.
Mean Deviation (Absolute Mean Deviation):
Original mean deviation: \( \frac{\sum |x - \bar{x}|}{n} \)
New mean deviation: \( \frac{\sum |2x - 2\bar{x}|}{n} = \frac{\sum 2|x - \bar{x}|}{n} = 2 \cdot \frac{\sum |x - \bar{x}|}{n} = 2 \times \) original mean deviation.
Standard Deviation:
Original standard deviation: \( s = \sqrt{\frac{\sum (x - \bar{x})^2}{n - 1}} \) (for sample) or \( \sigma = \sqrt{\frac{\sum (x - \mu)^2}{N}} \) (for population)
New standard deviation: \( s' = \sqrt{\frac{\sum (2x - 2\bar{x})^2}{n - 1}} = \sqrt{\frac{4\sum (x - \bar{x})^2}{n - 1}} = 2 \sqrt{\frac{\sum (x - \bar{x})^2}{n - 1}} = 2s \)
So standard deviation doubles.
Step 3: Conclusion
When each score is doubled:
- Mean, median, mode, range, mean deviation, and standard deviation all double.
For example, if original mean was \( \bar{x} \), new mean is \( 2\bar{x} \); original median \( M \), new median \( 2M \); original mode \( Mo \), new mode \( 2Mo \); original range \( R \), new range \( 2R \); original mean deviation \( MD \), new mean deviation \( 2MD \); original standard deviation \( SD \), new standard deviation \( 2SD \).
Final Answer
If the teacher doubles each student’s score, the mean, median, mode, range, mean deviation, and standard deviation will all double. The dot plot will have all points shifted to twice their original values (e.g., a score of 31 becomes 62, 70 becomes 140, 79 becomes 158, 97 becomes 194), with the same frequency distribution (shape of the dot plot remains the same, but stretched horizontally by a factor of 2).

Snap & solve any problem in the app
Get step-by-step solutions on Sovi AI
Photo-based solutions with guided steps
Explore more problems and detailed explanations
To solve the problem of analyzing the effect of doubling scores on statistics (mean, median, mode, range, mean deviation, standard deviation), we follow these steps:
Step 1: Recall the original data
The original scores are: \( 31, 79, 97, 70, 70, 79 \) (wait, let's check the data again. From the paper, the scores seem to be \( 31, 79, 97, 70, 70, 79 \)? Wait, maybe the original data is \( 31, 79, 97, 70, 70, 79 \)? Wait, let's list the original scores properly. Let's assume the original scores are \( 31, 79, 97, 70, 70, 79 \) (maybe with some duplicates). Wait, actually, looking at the paper, the scores are: \( 31, 79, 97, 70, 70, 79 \) (let's confirm: the data points are 31, 79, 97, 70, 70, 79? Wait, maybe the original data is \( 31, 79, 97, 70, 70, 79 \). Let's compute the original statistics first, then see the effect of doubling.
Step 2: Effect of doubling scores on each statistic
Let the original score be \( x \), new score be \( 2x \).
Mean:
Original mean: \( \bar{x} = \frac{\sum x}{n} \)
New mean: \( \bar{x}' = \frac{\sum (2x)}{n} = 2 \cdot \frac{\sum x}{n} = 2\bar{x} \)
So mean doubles.
Median:
Median is the middle value (or average of two middle values). If we double each score, the order of scores remains the same (since doubling is a monotonic transformation). So the new median is \( 2 \times \) original median.
Mode:
Mode is the most frequent value. Doubling each score will double the mode (since the most frequent value, when doubled, becomes the new most frequent value with the same frequency).
Range:
Range = Max - Min
New range = \( 2 \times \) Max - \( 2 \times \) Min = \( 2(Max - Min) = 2 \times \) original range.
Mean Deviation (Absolute Mean Deviation):
Original mean deviation: \( \frac{\sum |x - \bar{x}|}{n} \)
New mean deviation: \( \frac{\sum |2x - 2\bar{x}|}{n} = \frac{\sum 2|x - \bar{x}|}{n} = 2 \cdot \frac{\sum |x - \bar{x}|}{n} = 2 \times \) original mean deviation.
Standard Deviation:
Original standard deviation: \( s = \sqrt{\frac{\sum (x - \bar{x})^2}{n - 1}} \) (for sample) or \( \sigma = \sqrt{\frac{\sum (x - \mu)^2}{N}} \) (for population)
New standard deviation: \( s' = \sqrt{\frac{\sum (2x - 2\bar{x})^2}{n - 1}} = \sqrt{\frac{4\sum (x - \bar{x})^2}{n - 1}} = 2 \sqrt{\frac{\sum (x - \bar{x})^2}{n - 1}} = 2s \)
So standard deviation doubles.
Step 3: Conclusion
When each score is doubled:
- Mean, median, mode, range, mean deviation, and standard deviation all double.
For example, if original mean was \( \bar{x} \), new mean is \( 2\bar{x} \); original median \( M \), new median \( 2M \); original mode \( Mo \), new mode \( 2Mo \); original range \( R \), new range \( 2R \); original mean deviation \( MD \), new mean deviation \( 2MD \); original standard deviation \( SD \), new standard deviation \( 2SD \).
Final Answer
If the teacher doubles each student’s score, the mean, median, mode, range, mean deviation, and standard deviation will all double. The dot plot will have all points shifted to twice their original values (e.g., a score of 31 becomes 62, 70 becomes 140, 79 becomes 158, 97 becomes 194), with the same frequency distribution (shape of the dot plot remains the same, but stretched horizontally by a factor of 2).