QUESTION IMAGE
Question
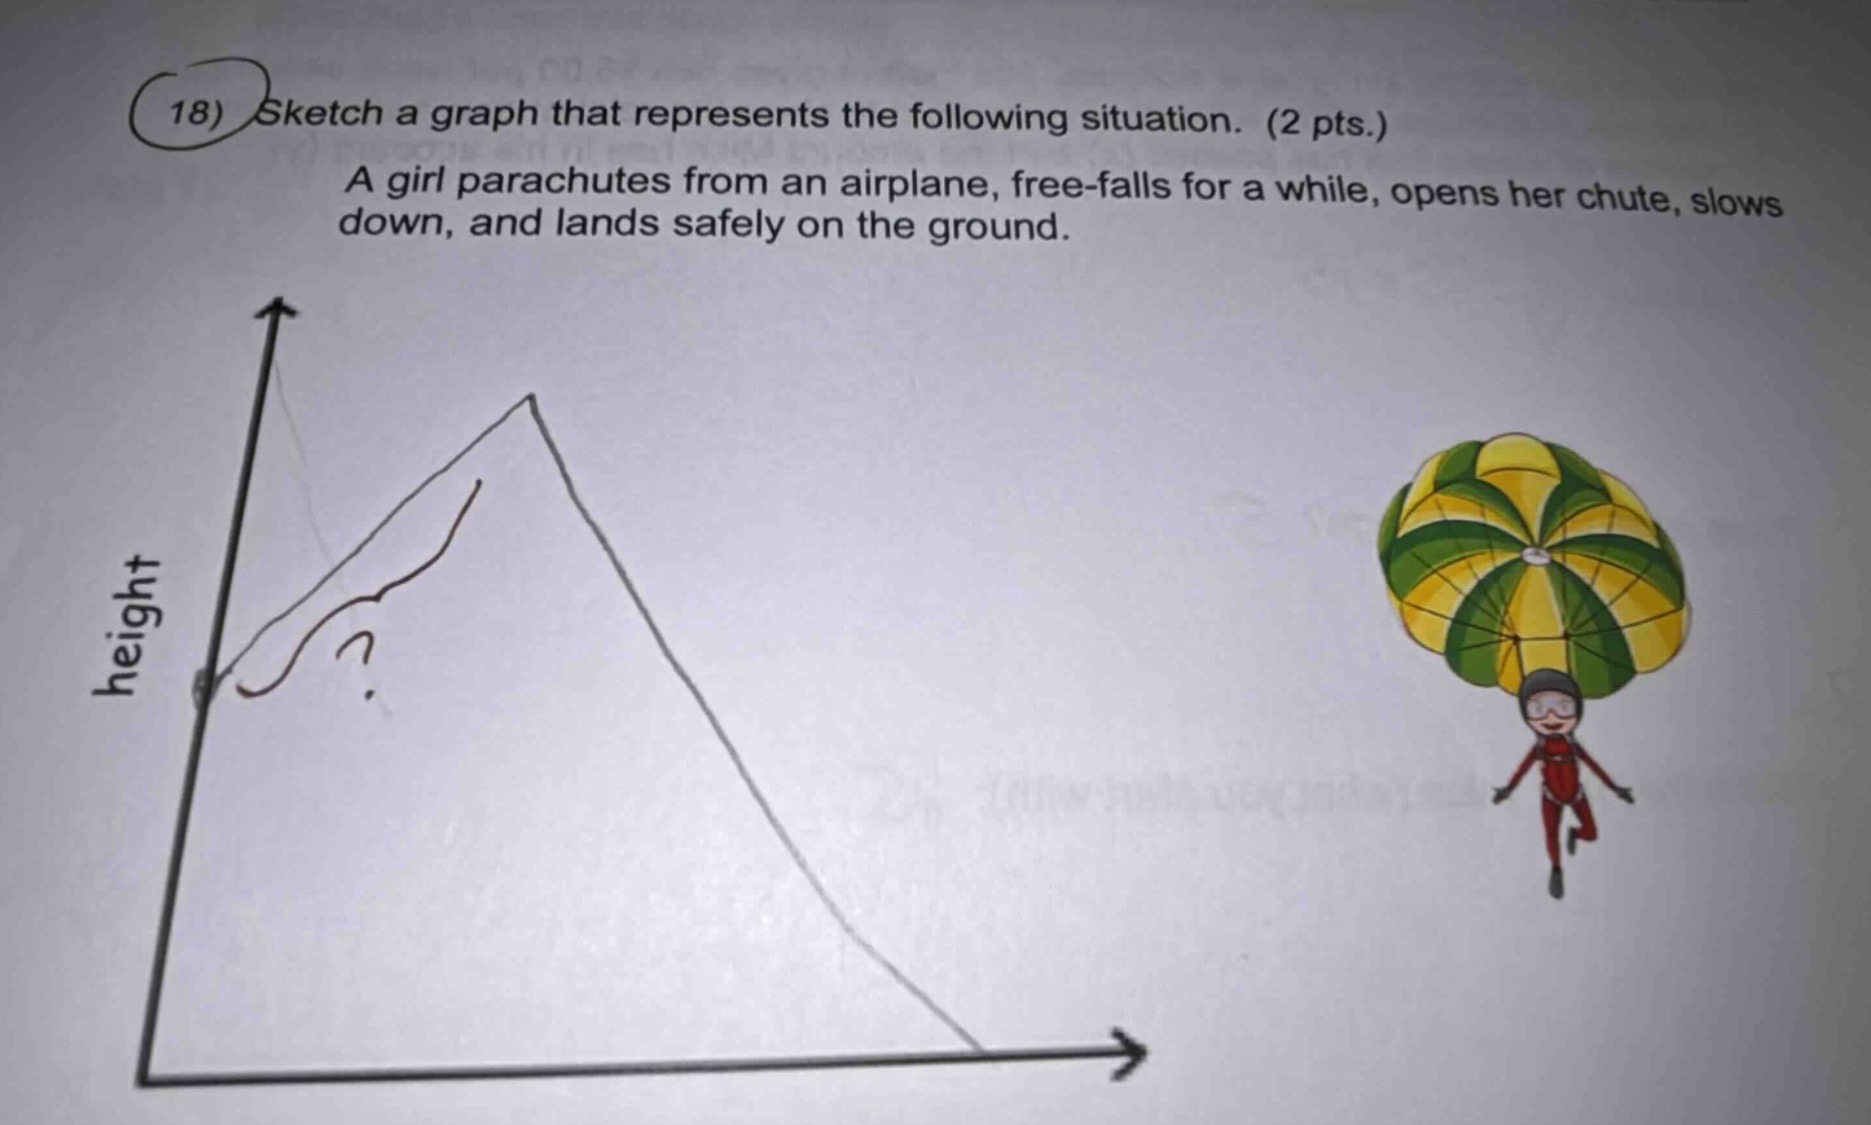
- sketch a graph that represents the following situation. (2 pts.) a girl parachutes from an airplane, free-falls for a while, opens her chute, slows down, and lands safely on the ground.
Brief Explanations
The graph plots height (y-axis) vs. time (x-axis):
- Start at a high, constant height (airplane altitude, flat horizontal segment).
- First segment: Steep downward curve with increasing slope (free fall, accelerating downward, height decreases faster over time).
- Second segment: Less steep downward curve that levels to a constant slope (parachute opens, decelerates then reaches constant slow descent, height decreases at a steady, slower rate).
- Final segment: Flat horizontal line at height = 0 (lands on ground, height stays constant).

Snap & solve any problem in the app
Get step-by-step solutions on Sovi AI
Photo-based solutions with guided steps
Explore more problems and detailed explanations
A correct graph has 4 key segments (left to right):
- Flat horizontal line at maximum height (waiting to jump/initial airplane altitude).
- Downward-opening concave curve (free fall, accelerating speed).
- Shallow, straight downward line (steady slow descent after parachute opens).
- Flat horizontal line at height = 0 (on the ground).