QUESTION IMAGE
Question
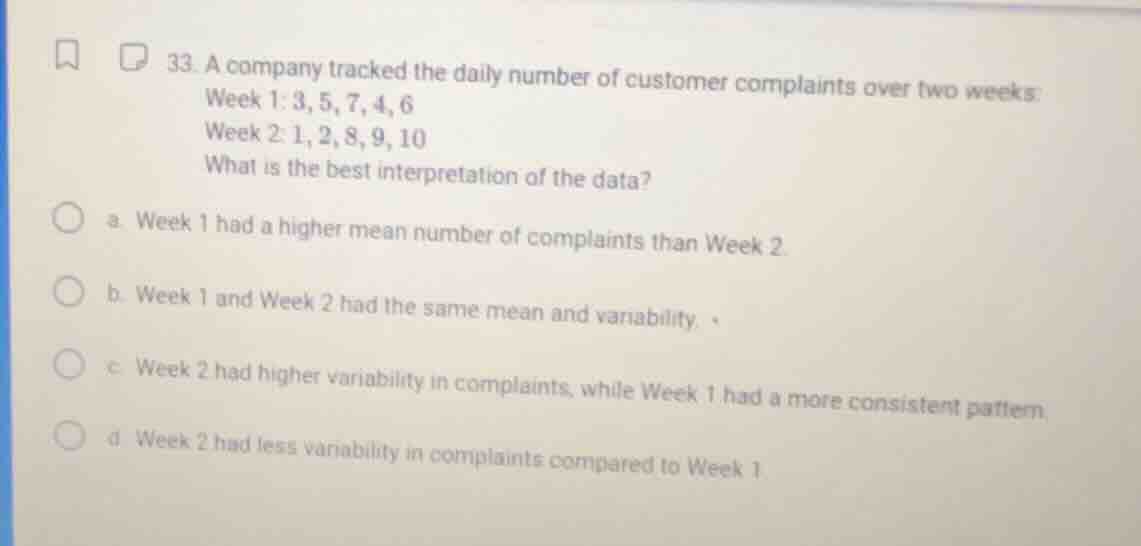
- a company tracked the daily number of customer complaints over two weeks:
week 1: 3, 5, 7, 4, 6
week 2: 1, 2, 8, 9, 10
what is the best interpretation of the data?
a. week 1 had a higher mean number of complaints than week 2.
b. week 1 and week 2 had the same mean and variability.
c. week 2 had higher variability in complaints, while week 1 had a more consistent pattern.
d. week 2 had less variability in complaints compared to week 1.

Snap & solve any problem in the app
Get step-by-step solutions on Sovi AI
Photo-based solutions with guided steps
Explore more problems and detailed explanations
c. Week 2 had higher variability in complaints, while Week 1 had a more consistent pattern.