QUESTION IMAGE
Question
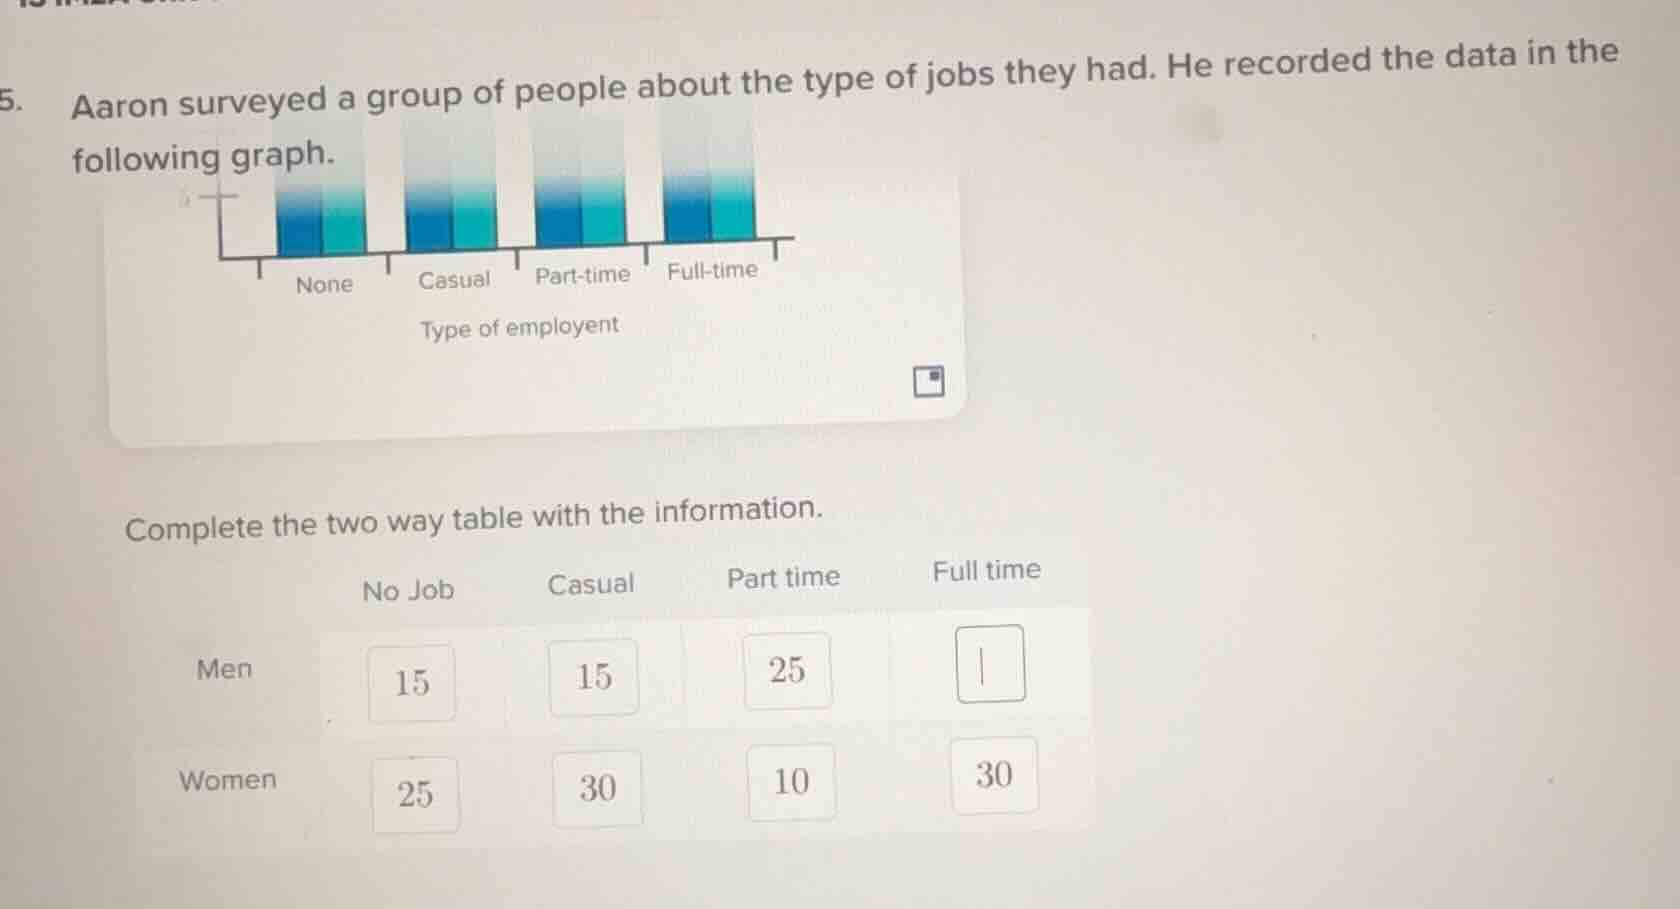
- aaron surveyed a group of people about the type of jobs they had. he recorded the data in the following graph. complete the two way table with the information. no job casual part time full time men 15 15 25 \boxed{} women 25 30 10 30
Step1: Analyze the bar graph pattern
Assume the total height (sum of men and women) for each employment type is equal (from the bar graph's visual symmetry). So for "Full - time", sum of men and women should match other types? Wait, no, maybe the bar graph shows that the number of men and women in full - time has the same ratio as other? Wait, looking at the bar graph, the blue (men) and cyan (women) parts for each employment type: "None": men = 15, women = 25; "Casual": men = 15, women = 30; "Part - time": men = 25, women = 10; "Full - time": Let's check the ratio of men to women in each. Wait, maybe the bar graph's blue and cyan sections for "Full - time" are equal in height to "Casual" or "None"? Wait, no, the two - way table: Let's check the sum of each column? Wait, no, the bar graph: for each employment type (None, Casual, Part - time, Full - time), the blue (men) and cyan (women) bars. From the table, for "Full - time", women are 30. Looking at the bar graph, the blue (men) bar for Full - time should be equal to the blue bar for Casual? Wait, Casual men:15, Full - time men? Wait, no, maybe the bar graph's blue and cyan for Full - time are same as Casual? Wait, no, let's look at the two - way table. Wait, the bar graph: the height of the blue (men) and cyan (women) for each employment type. Let's check the "Casual" row: men = 15, women = 30. "Full - time" women = 30, so maybe men in Full - time is equal to men in Casual? Wait, Casual men is 15? No, wait, the bar graph's visual: the blue part (men) for Full - time is same as blue part for Casual? Wait, no, maybe the sum of men and women for each employment type. Wait, "None": 15 + 25 = 40; "Casual":15 + 30 = 45; "Part - time":25+10 = 35; "Full - time":x + 30. But the bar graph shows that the bars for "None", "Casual", "Part - time", "Full - time" have the same total height? Wait, the original bar graph (as per the problem) has four bars, each with blue (men) and cyan (women) parts. Looking at the two - way table, for "Full - time", women are 30. Looking at the bar graph, the blue (men) bar for Full - time should be equal to the blue bar for Casual (15) or Part - time? Wait, no, maybe the bar graph's blue and cyan for Full - time are same as "Casual" in terms of men's and women's counts? Wait, Casual: men = 15, women = 30. Full - time: women = 30, so men should be 15? Wait, but let's check the "Part - time" men = 25, women = 10. No, maybe the bar graph's blue (men) for Full - time is equal to the blue bar for "None" or "Casual". Wait, the two - way table: the "Full - time" men's cell is empty. Looking at the bar graph, the blue (men) bar for Full - time is the same height as the blue bar for "Casual" (which is 15) or "None" (15)? Wait, "None" men:15, "Casual" men:15, "Part - time" men:25, "Full - time" men:? The bar graph's blue bar for Full - time looks same as "Casual" and "None" blue bars. And women for Full - time is 30, same as "Casual" women (30). So men in Full - time should be 15, same as "Casual" men.
Step2: Confirm with the table
Looking at the two - way table, for "Casual", men = 15, women = 30. For "Full - time", women = 30, so men should be 15 (to match the bar graph's visual symmetry, as the blue and cyan bars for "Casual" and "Full - time" look the same in height).

Snap & solve any problem in the app
Get step-by-step solutions on Sovi AI
Photo-based solutions with guided steps
Explore more problems and detailed explanations
15