QUESTION IMAGE
Question
algebra: concepts and connections - plc
comparing data sets
analyzing histograms
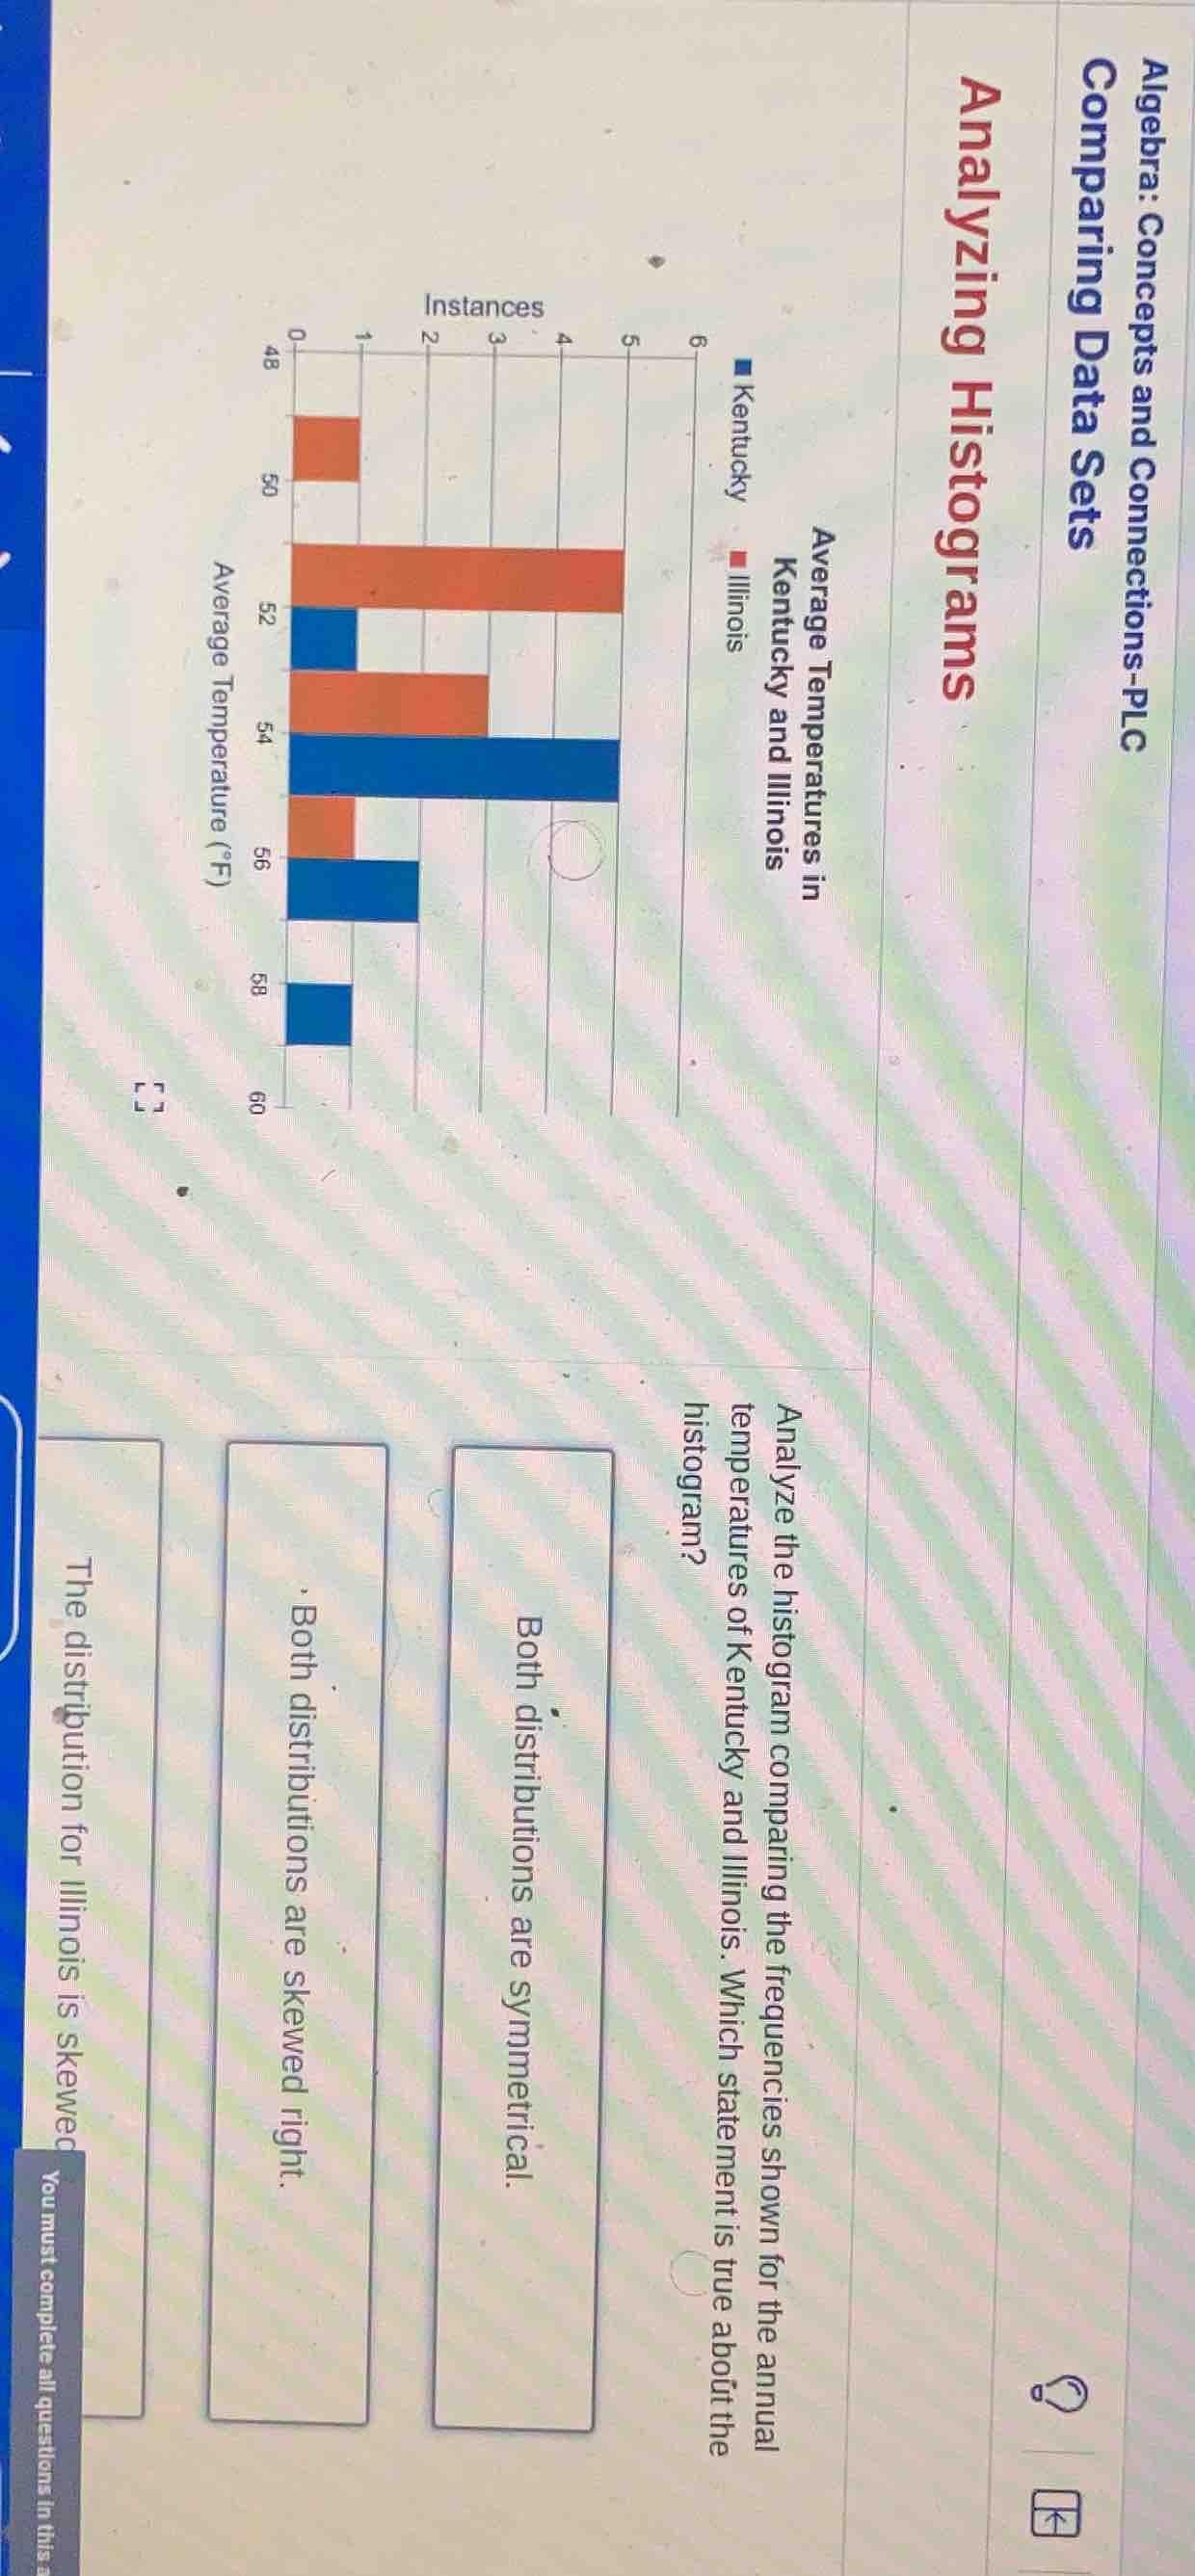
average temperatures in kentucky and illinois
■ kentucky
■ illinois
analyze the histogram comparing the frequencies shown for the annual temperatures of kentucky and illinois. which statement is true about the histogram?
options:
both distributions are symmetrical.
both distributions are skewed right.
the distribution for illinois is skewed...
(note: some text might be partially visible due to image cropping, but the main question and options are captured.)
To determine the correct statement, we analyze the histograms for Kentucky (blue) and Illinois (red). For a symmetric distribution, the left and right sides of the histogram (around the center) should mirror each other in frequency. For a right - skewed distribution, there are more lower - valued data points and a tail on the right.
- For Illinois (red bars): The bars are more concentrated on the left (lower temperatures like 50 - 52 have higher frequencies) and taper off on the right. This is a left - skewed (not right - skewed) distribution.
- For Kentucky (blue bars): The frequencies seem to be more evenly distributed around the center, and the left and right sides of the center (e.g., around 54 - 56) have a more balanced appearance, suggesting a symmetric distribution. But looking at the Illinois distribution again, it is not symmetric. Wait, maybe we misread. Wait, the option "The distribution for Illinois is skewed" – let's check the shape. In a skewed right distribution, the tail is on the right (higher values have the tail). For Illinois, the highest frequency is at 50 - 52, and then it decreases as temperature increases. So the tail is on the left? No, wait, skewness: if the mean is pulled in the direction of the tail. If most data is on the left (lower temperatures) and a few on the right, the tail is on the right? Wait, no. Let's recall: a right - skewed (positive skew) distribution has a longer tail on the right (higher values). A left - skewed (negative skew) has a longer tail on the left (lower values).
Looking at Illinois' histogram: the bars at lower temperatures (48 - 52) have higher frequencies, and as temperature increases (towards 60), the frequency decreases. So the tail is on the right (higher temperatures), which is a right - skewed distribution? Wait, no, 48 is lower, 60 is higher. If most data is at lower temperatures and a few at higher, the tail is on the higher (right) side, so it is right - skewed. But the option "The distribution for Illinois is skewed" – among the given options, let's check the other options. "Both distributions are symmetrical" – no, because Illinois' distribution is skewed. "Both distributions are skewed right" – Kentucky's distribution: let's see Kentucky's bars. At 52, 54, 56, 58. The frequencies at 52 (1), 54 (4), 56 (2), 58 (1). So it looks like a symmetric distribution (1,4,2,1 – wait, maybe not perfect, but more symmetric than Illinois). So Illinois' distribution is skewed (either left or right), and Kentucky's is more symmetric. So the statement "The distribution for Illinois is skewed" is correct. Wait, but maybe the original options: looking at the image, the options are "Both distributions are symmetrical", "Both distributions are skewed right", "The distribution for Illinois is skewed". So the correct one is "The distribution for Illinois is skewed" because Illinois' histogram does not have a symmetrical shape (it has a tail or uneven distribution), while Kentucky's may be more symmetric or not, but Illinois' is skewed.

Snap & solve any problem in the app
Get step-by-step solutions on Sovi AI
Photo-based solutions with guided steps
Explore more problems and detailed explanations
The distribution for Illinois is skewed