QUESTION IMAGE
Question
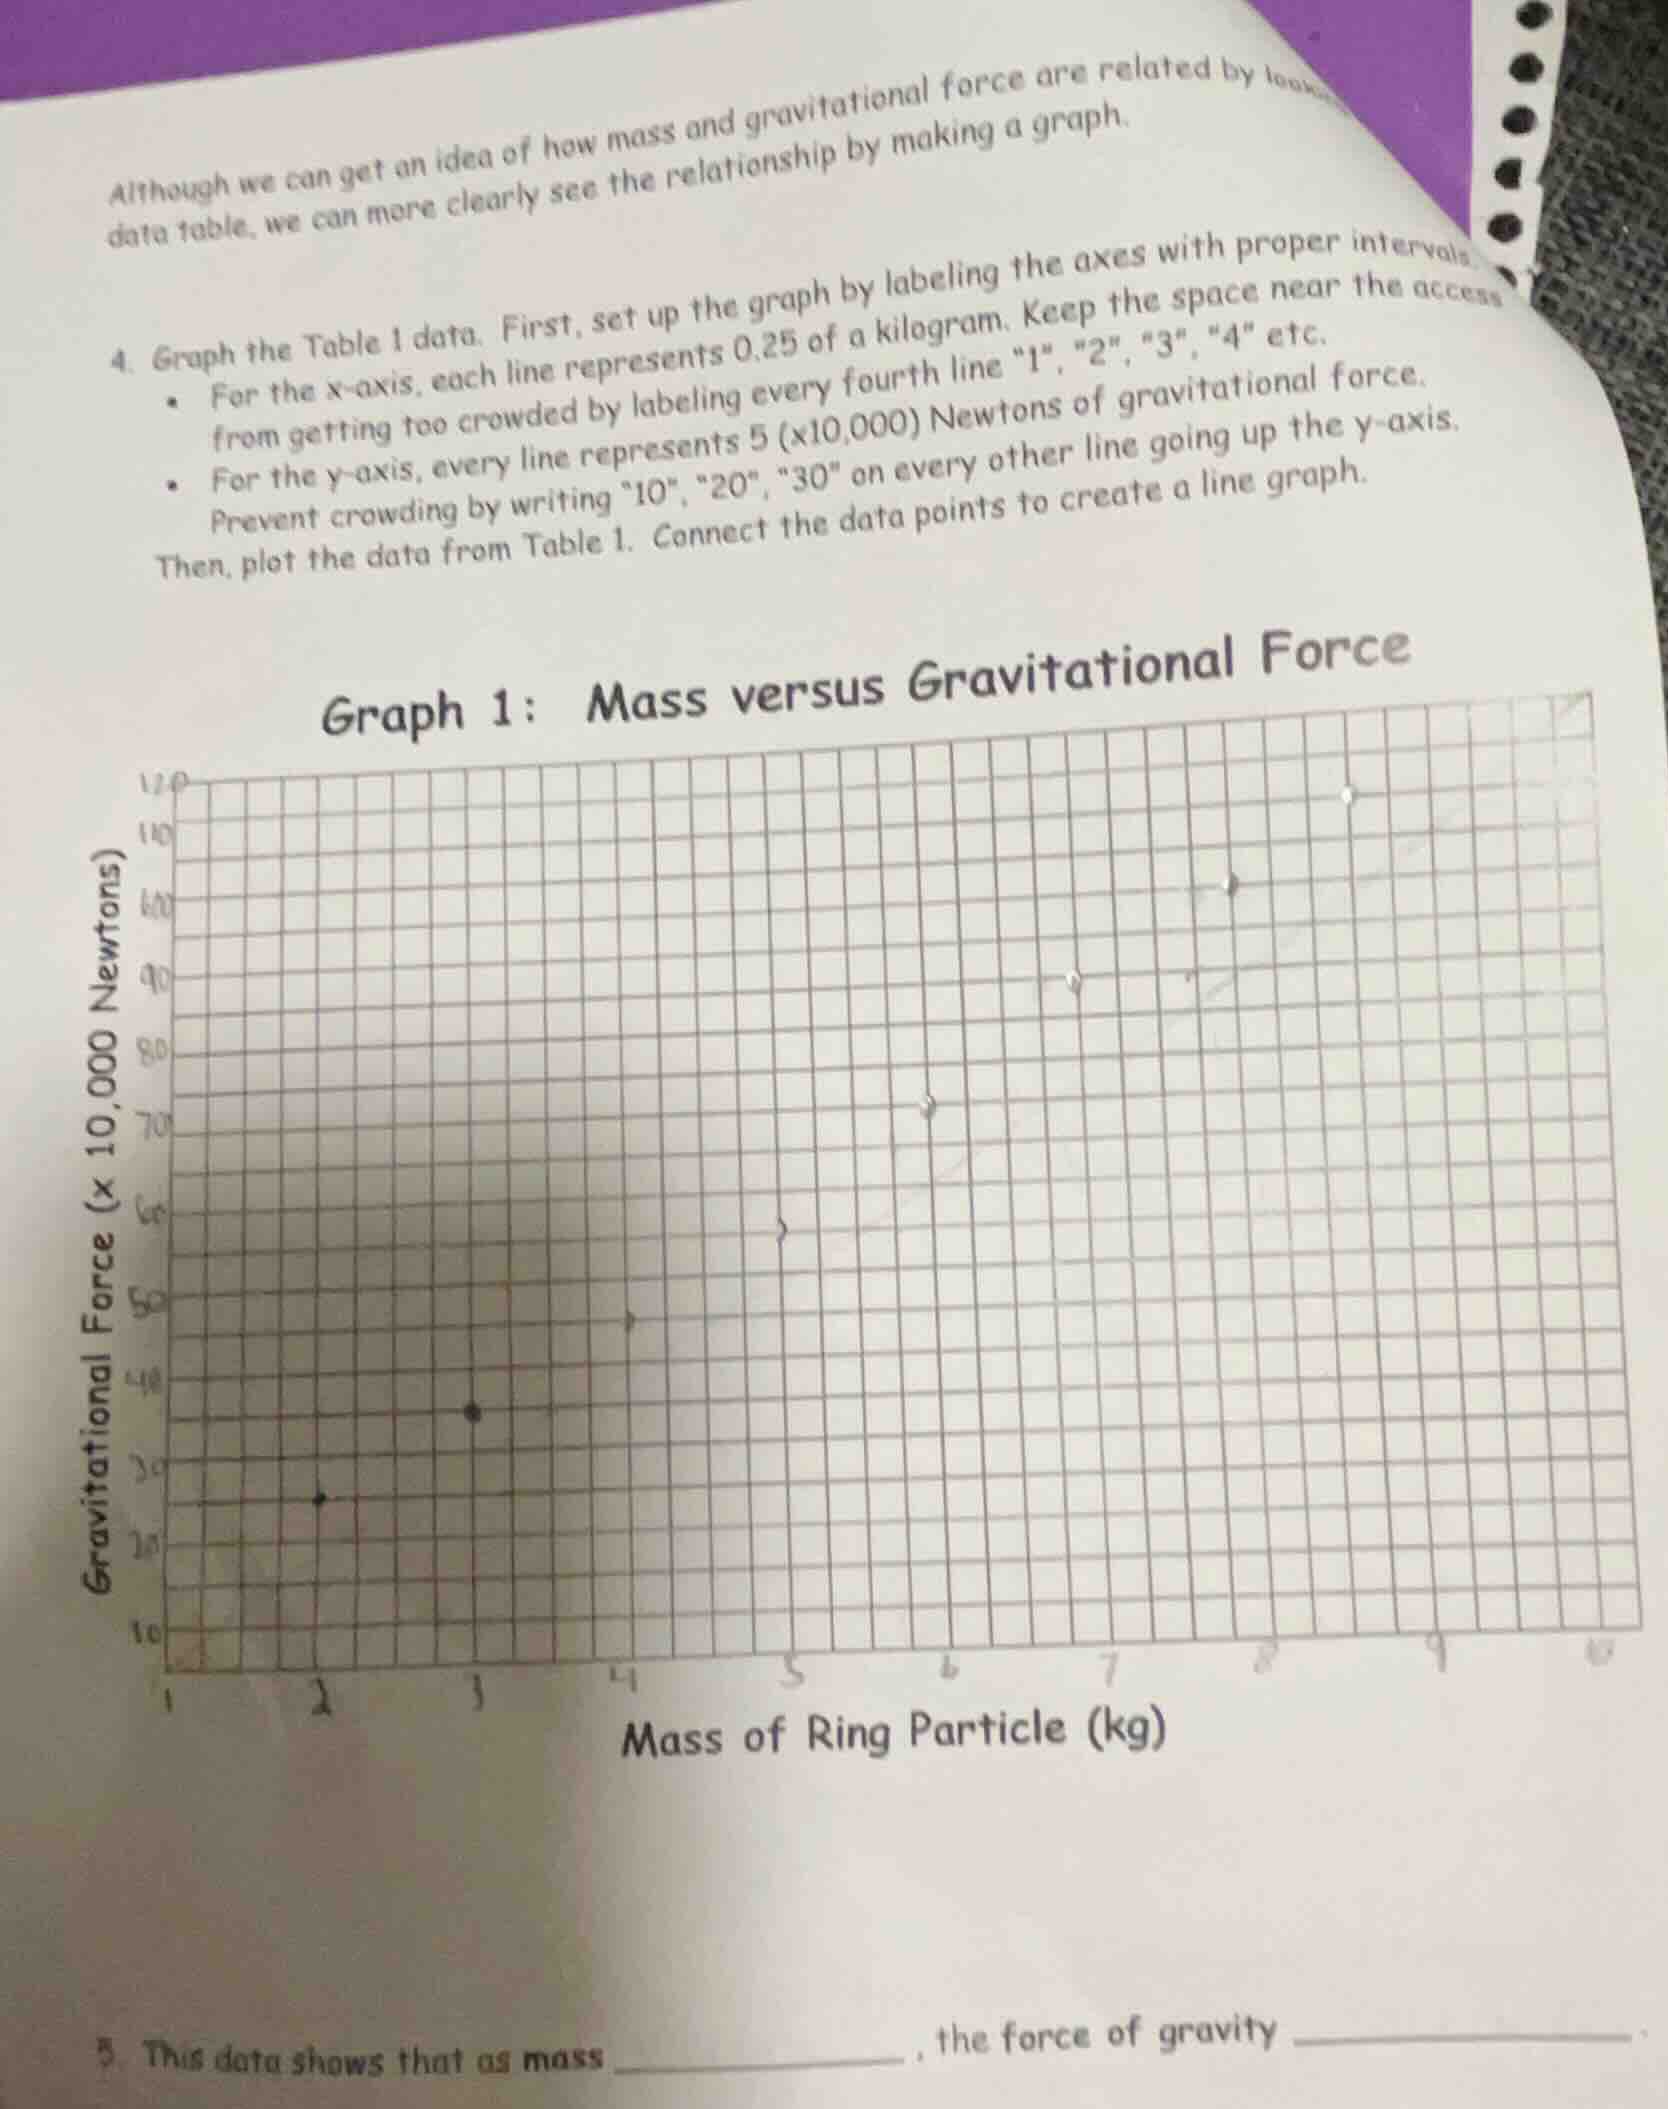
although we can get an idea of how mass and gravitational force are related by look data table, we can more clearly see the relationship by making a graph. 4. graph the table 1 data. first, set up the graph by labeling the axes with proper intervals. - for the x - axis, each line represents 0.25 of a kilogram. keep the space near the access from getting too crowded by labeling every fourth line “1”, “2”, “3”, “4” etc. - for the y - axis, every line represents 5 (×10,000) newtons of gravitational force. prevent crowding by writing “10”, “20”, “30” on every other line going up the y - axis. then, plot the data from table 1. connect the data points to create a line graph. graph 1: mass versus gravitational force 5. this data shows that as mass ______, the force of gravity ______.
The line graph shows a direct linear relationship: as the mass (x-axis) increases, the gravitational force (y-axis) increases proportionally, which aligns with the physical law of gravitational force being directly proportional to mass near Earth's surface.

Snap & solve any problem in the app
Get step-by-step solutions on Sovi AI
Photo-based solutions with guided steps
Explore more problems and detailed explanations
This data shows that as mass increases, the force of gravity increases proportionally