QUESTION IMAGE
Question
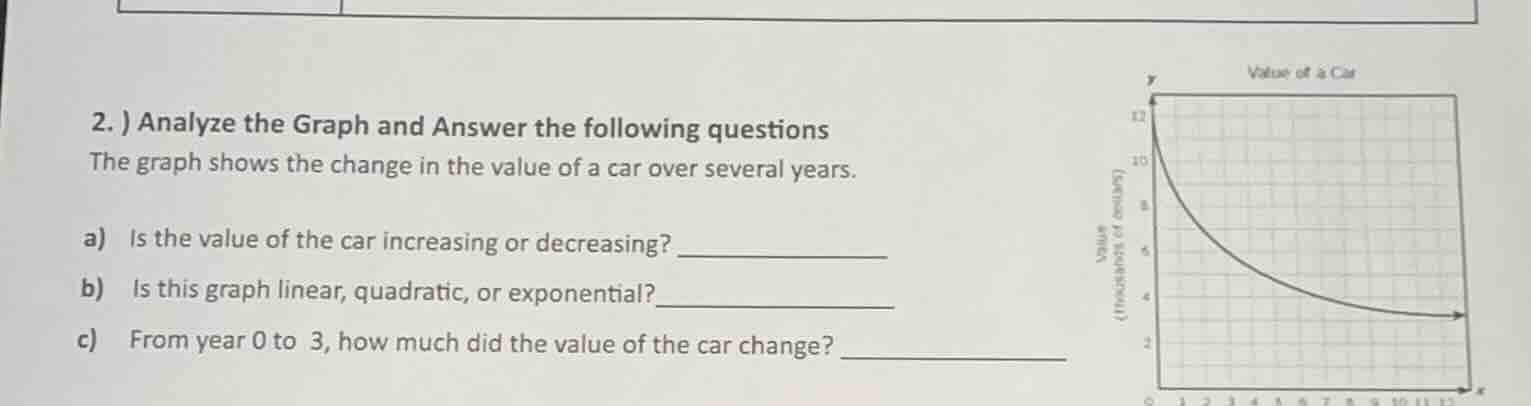
- ) analyze the graph and answer the following questions
the graph shows the change in the value of a car over several years.
a) is the value of the car increasing or decreasing? ______________
b) is this graph linear, quadratic, or exponential?_______________
c) from year 0 to 3, how much did the value of the car change? ______________
Part a)
By observing the graph (which shows the value of a car over years), as the number of years (x - axis) increases, the value of the car (y - axis) moves downward, indicating a decrease.
A linear graph has a constant slope (straight line), a quadratic graph is a parabola (U - shaped or inverted U - shaped), and an exponential graph has a curve that either increases or decreases with a non - constant rate of change. The given graph of the car's value is a curve that is decreasing and has the shape characteristic of an exponential decay (or exponential function with a base between 0 and 1), not a straight line (linear) or a parabola (quadratic).
Step 1: Find the value at year 0
From the graph, at \(x = 0\) (year 0), the value of the car (y - value) is 12 (thousand dollars, assuming the y - axis is in thousands).
Step 2: Find the value at year 3
We need to estimate the value at \(x=3\). By looking at the graph, at \(x = 3\), the value of the car is 6 (thousand dollars).
Step 3: Calculate the change in value
The change in value is the initial value minus the final value (since it's decreasing). So, \(\text{Change}=12 - 6=6\) (thousand dollars).

Snap & solve any problem in the app
Get step-by-step solutions on Sovi AI
Photo-based solutions with guided steps
Explore more problems and detailed explanations
Decreasing