QUESTION IMAGE
Question
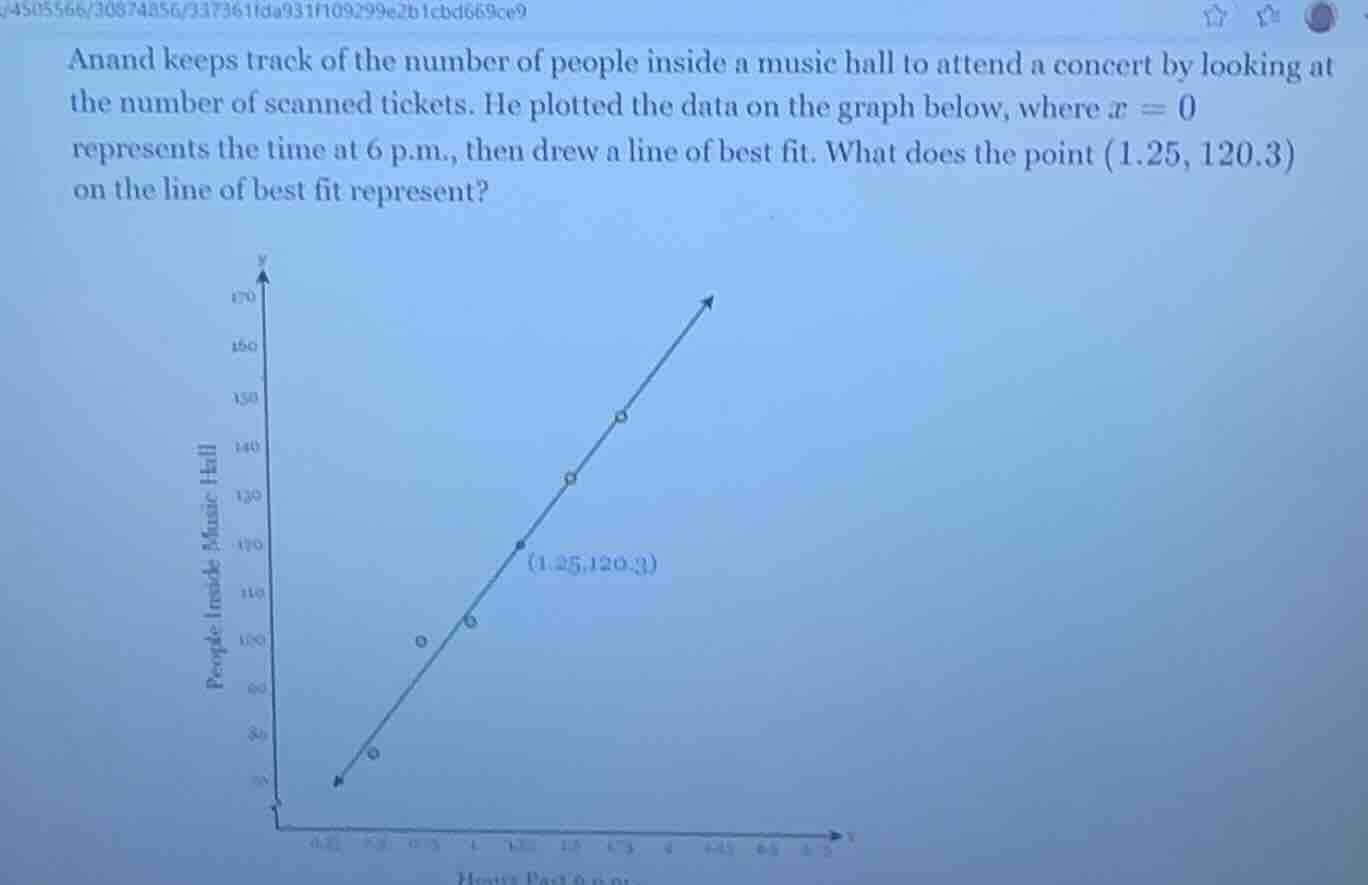
anand keeps track of the number of people inside a music hall to attend a concert by looking at the number of scanned tickets. he plotted the data on the graph below, where ( x = 0 ) represents the time at 6 p.m., then drew a line of best fit. what does the point ( (1.25, 120.3) ) on the line of best fit represent? graph showing a scatter plot with a line of best fit, and the point ( (1.25, 120.3) ) marked on the line
Step1: Understand x - axis meaning
x = 0 is 6 p.m., so x = 1.25 means 1.25 hours after 6 p.m. 1.25 hours = 1 hour + 0.25×60 minutes = 1 hour 15 minutes, so time is 7:15 p.m.
Step2: Understand y - axis meaning
y - axis is number of people inside music hall, so y = 120.3 is the predicted number of people.
Step3: Interpret the point
The point (1.25, 120.3) on the line of best fit means 1.25 hours (or 1 hour 15 minutes) after 6 p.m. (i.e., at 7:15 p.m.), the line of best fit predicts that there are approximately 120.3 people inside the music hall.

Snap & solve any problem in the app
Get step-by-step solutions on Sovi AI
Photo-based solutions with guided steps
Explore more problems and detailed explanations
1.25 hours (or 1 hour 15 minutes) after 6 p.m. (at 7:15 p.m.), the line of best fit predicts about 120.3 people are inside the music hall.