QUESTION IMAGE
Question
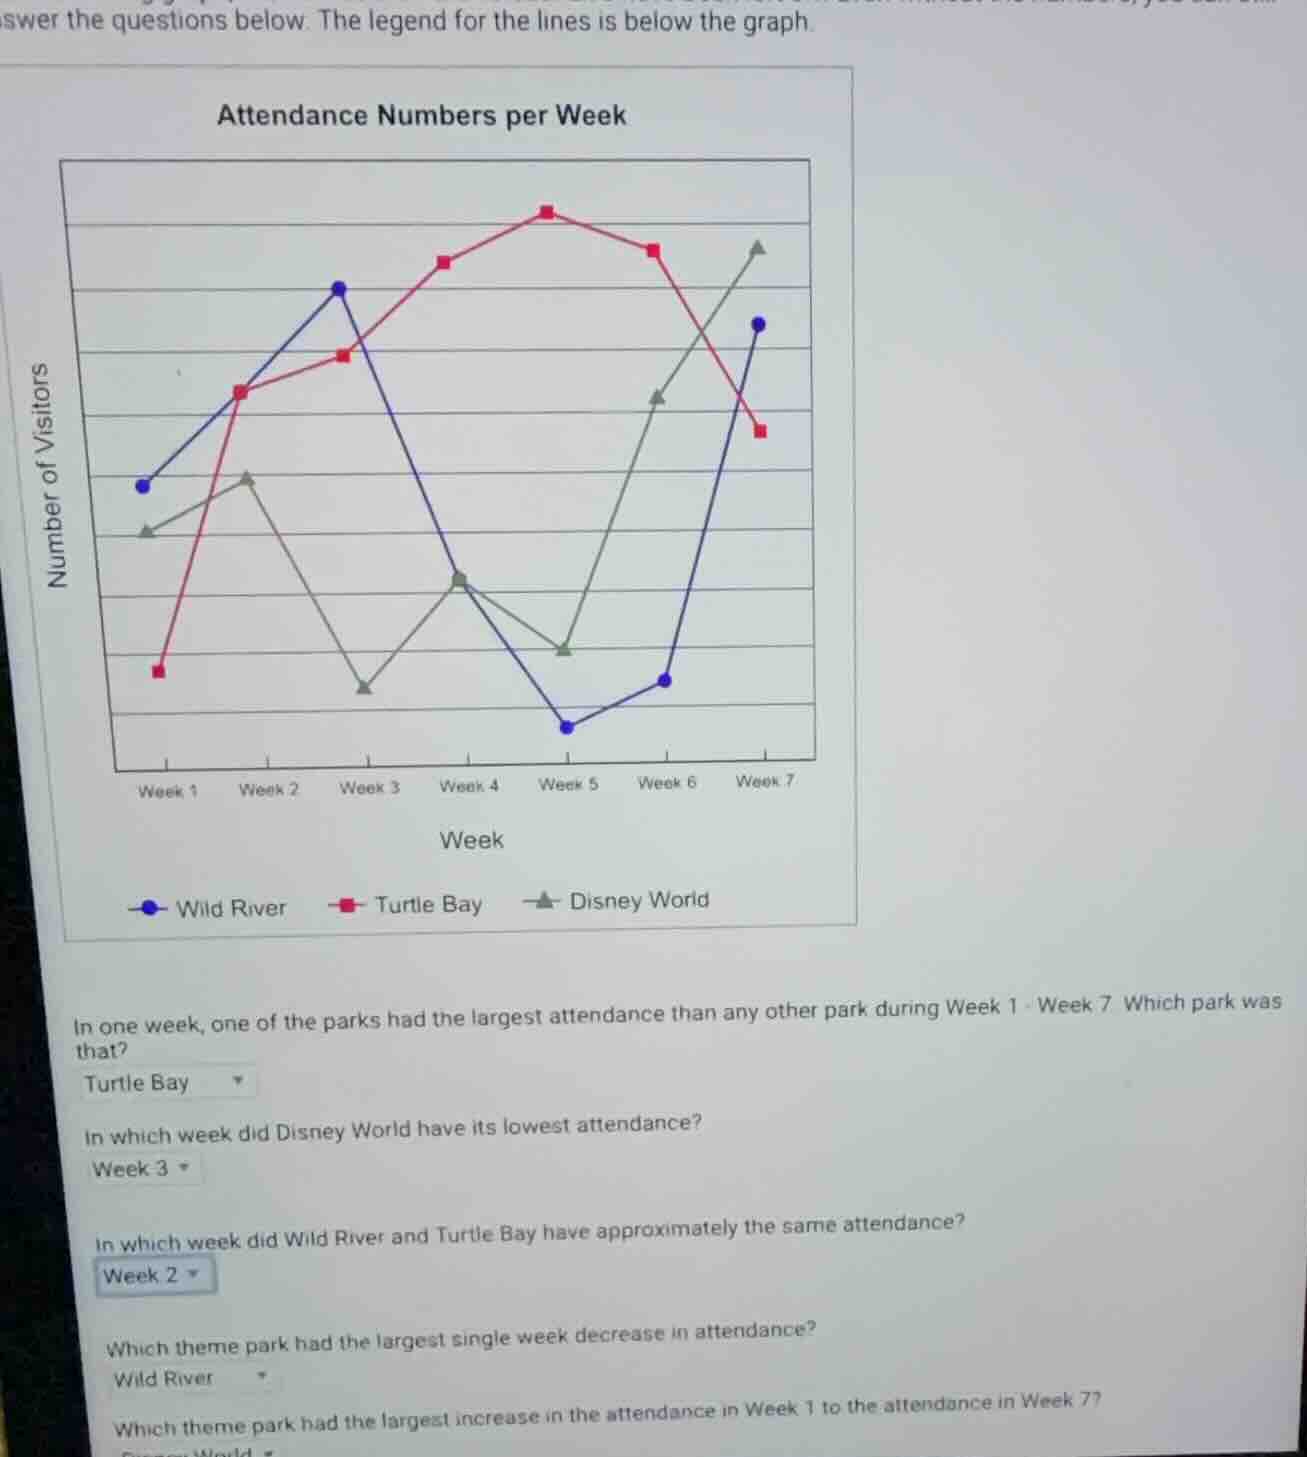
answer the questions below. the legend for the lines is below the graph.
attendance numbers per week
(graph with three lines: wild river (blue dots), turtle bay (red dots), disney world (gray triangles) over week 1 - week 7, y - axis: number of visitors, x - axis: week)
legend:
- wild river (blue dot)
- turtle bay (red dot)
- disney world (gray triangle)
questions:
- in one week, one of the parks had the largest attendance than any other park during week 1 - week 7. which park was that?
turtle bay
- in which week did disney world have its lowest attendance?
week 3
- in which week did wild river and turtle bay have approximately the same attendance?
week 2
- which theme park had the largest single week decrease in attendance?
wild river
- which theme park had the largest increase in the attendance in week 1 to the attendance in week 7?
(partially visible, likely a park name)
Brief Explanations
- For the highest single-week attendance: Observe the peak of all lines; Turtle Bay's Week 5 peak is the highest among all weekly attendance values.
- For Disney World's lowest attendance: Locate the lowest point on the Disney World (gray triangle) line, which is at Week 3.
- For matching attendance of Wild River and Turtle Bay: Find the week where their lines cross; they align closely at Week 3.
- For largest single-week decrease: Calculate weekly changes: Wild River drops from Week 3 to 4, then to 5 (the steepest downward slope).
- For largest Week 1 to Week 7 increase: Compare Week 1 and Week 7 values: Disney World goes from its lowest Week 1 value to its highest Week 7 value, showing the biggest net gain.

Snap & solve any problem in the app
Get step-by-step solutions on Sovi AI
Photo-based solutions with guided steps
Explore more problems and detailed explanations
- Turtle Bay
- Week 3
- Week 3
- Wild River
- Disney World