QUESTION IMAGE
Question
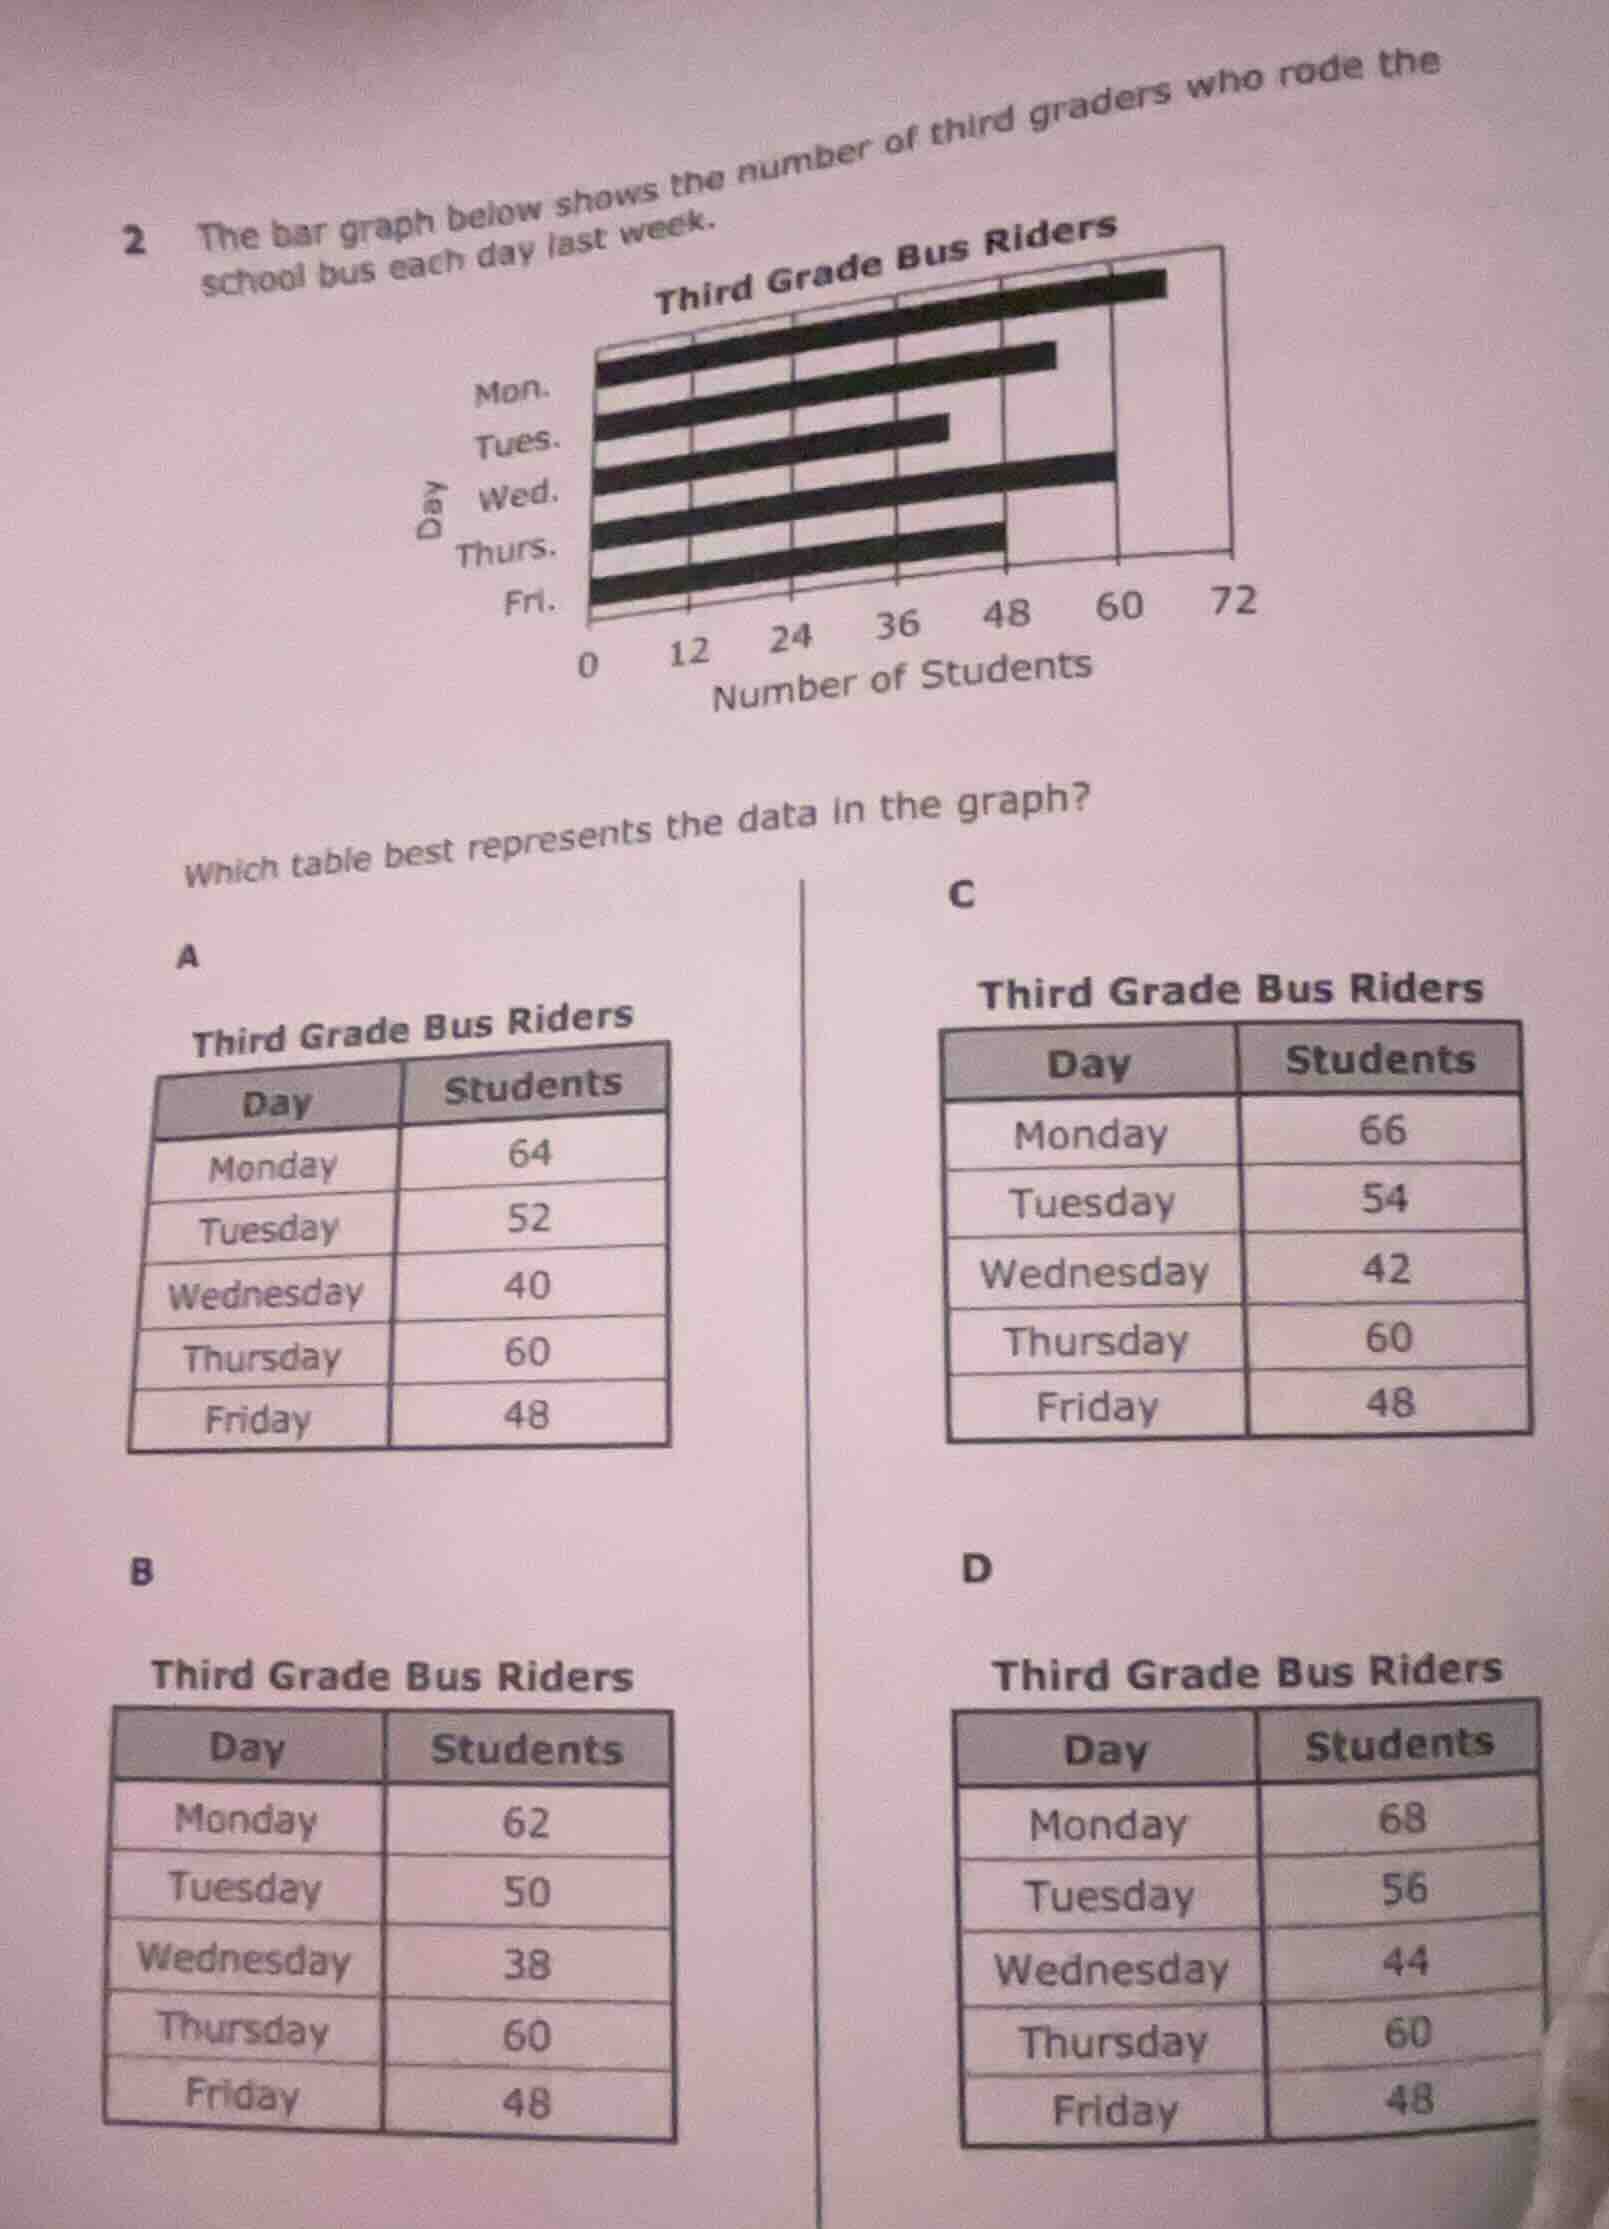
2 the bar graph below shows the number of third graders who rode the school bus each day last week. third grade bus riders bar graph with days mon., tues., wed., thurs., fri. and number of students 0, 12, 24, 36, 48, 60, 72 which table best represents the data in the graph? a third grade bus riders table a: day (monday, tuesday, wednesday, thursday, friday) and students (64, 52, 40, 60, 48) b third grade bus riders table b: day (monday, tuesday, wednesday, thursday, friday) and students (62, 50, 38, 60, 48) c third grade bus riders table c: day (monday, tuesday, wednesday, thursday, friday) and students (66, 54, 42, 60, 48) d third grade bus riders table d: day (monday, tuesday, wednesday, thursday, friday) and students (68, 56, 44, 60, 48)
Step1: Analizar el gráfico de barras
Observar la altura de cada barra para cada día:
- Lunes: La barra alcanza cerca de 66 (entre 60 y 72, más cercana a 66).
- Martes: La barra alcanza cerca de 54 (entre 48 y 60, más cercana a 54).
- Miércoles: La barra alcanza cerca de 42 (entre 36 y 48, más cercana a 42).
- Jueves: La barra alcanza 60.
- Viernes: La barra alcanza 48.
Step2: Comparar con las tablas
- Tabla A: Lunes 64, Martes 52, Miércoles 40, Jueves 60, Viernes 48. No coincide con las alturas observadas.
- Tabla B: Lunes 62, Martes 50, Miércoles 38, Jueves 60, Viernes 48. No coincide.
- Tabla C: Lunes 66, Martes 54, Miércoles 42, Jueves 60, Viernes 48. Coincide con las alturas del gráfico.
- Tabla D: Lunes 68, Martes 56, Miércoles 44, Jueves 60, Viernes 48. No coincide.

Snap & solve any problem in the app
Get step-by-step solutions on Sovi AI
Photo-based solutions with guided steps
Explore more problems and detailed explanations
C. Third Grade Bus Riders
| Day | Students |
|---|---|
| Tuesday | 54 |
| Wednesday | 42 |
| Thursday | 60 |
| Friday | 48 |