QUESTION IMAGE
Question
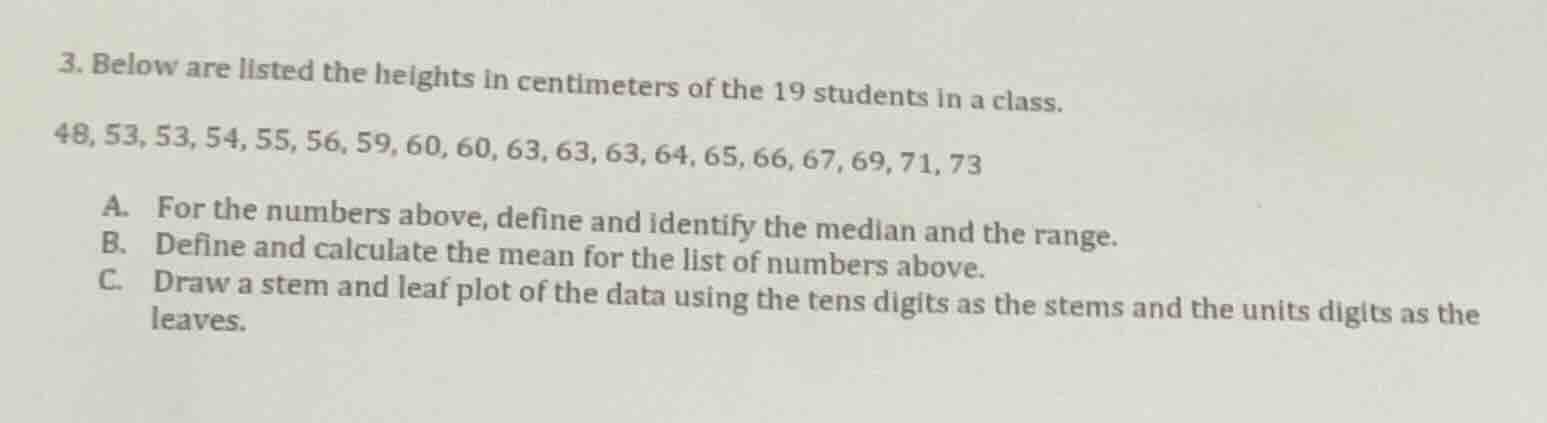
- below are listed the heights in centimeters of the 19 students in a class.
48, 53, 53, 54, 55, 56, 59, 60, 60, 63, 63, 63, 64, 65, 66, 67, 69, 71, 73
a. for the numbers above, define and identify the median and the range.
b. define and calculate the mean for the list of numbers above.
c. draw a stem and leaf plot of the data using the tens digits as the stems and the units digits as the leaves.
Part A
Step1: Define Median
The median is the middle value of a data set when it is ordered from least to greatest. If there are an odd number of observations, it is the middle number. For an even number, it's the average of the two middle numbers. Here, we have 19 (odd) data points.
The data is already ordered: \(48, 53, 53, 54, 55, 56, 59, 60, 60, 63, 63, 63, 64, 65, 66, 67, 69, 71, 73\)
The position of the median is \(\frac{n + 1}{2}=\frac{19+ 1}{2}=10^{\text{th}}\) term.
Looking at the ordered data, the \(10^{\text{th}}\) term is \(63\).
Step2: Define Range
The range is the difference between the maximum and minimum values in a data set.
Minimum value \(= 48\), Maximum value \(= 73\)
Range \(=\text{Maximum}-\text{Minimum}=73 - 48 = 25\)
Step1: Define Mean
The mean (average) of a data set is the sum of all the values divided by the number of values. The formula is \(\bar{x}=\frac{\sum_{i = 1}^{n}x_{i}}{n}\), where \(x_{i}\) are the data points and \(n\) is the number of data points.
Step2: Calculate Sum of Data Points
Sum \(S=48+53 + 53+54+55+56+59+60+60+63+63+63+64+65+66+67+69+71+73\)
\(48+(53\times2)+54 + 55+56+59+(60\times2)+(63\times3)+64+65+66+67+69+71+73\)
\(48 + 106+54+55+56+59+120+189+64+65+66+67+69+71+73\)
Calculate step - by - step:
\(48+106 = 154\); \(154 + 54=208\); \(208+55 = 263\); \(263+56 = 319\); \(319+59 = 378\); \(378+120 = 498\); \(498+189 = 687\); \(687+64 = 751\); \(751+65 = 816\); \(816+66 = 882\); \(882+67 = 949\); \(949+69 = 1018\); \(1018+71 = 1089\); \(1089+73=1162\)
Step3: Calculate Mean
\(n = 19\), so mean \(\bar{x}=\frac{S}{n}=\frac{1162}{19}\approx61.16\) (rounded to two decimal places) or as a fraction \(\frac{1162}{19}\)
To create a stem - and - leaf plot, we use the tens digit as the stem and the units digit as the leaf.
- Stem \(4\): Leaf is \(8\) (from \(48\))
- Stem \(5\): Leaves are \(3,3,4,5,6,9\) (from \(53,53,54,55,56,59\))
- Stem \(6\): Leaves are \(0,0,3,3,3,4,5,6,7,9\) (from \(60,60,63,63,63,64,65,66,67,69\))
- Stem \(7\): Leaves are \(1,3\) (from \(71,73\))

Snap & solve any problem in the app
Get step-by-step solutions on Sovi AI
Photo-based solutions with guided steps
Explore more problems and detailed explanations
Median: The middle value of the ordered data set, here it is \(63\) (since the \(10^{\text{th}}\) term in the ordered 19 - term data set is \(63\)).
Range: The difference between the maximum and minimum values, calculated as \(73-48 = 25\).