QUESTION IMAGE
Question
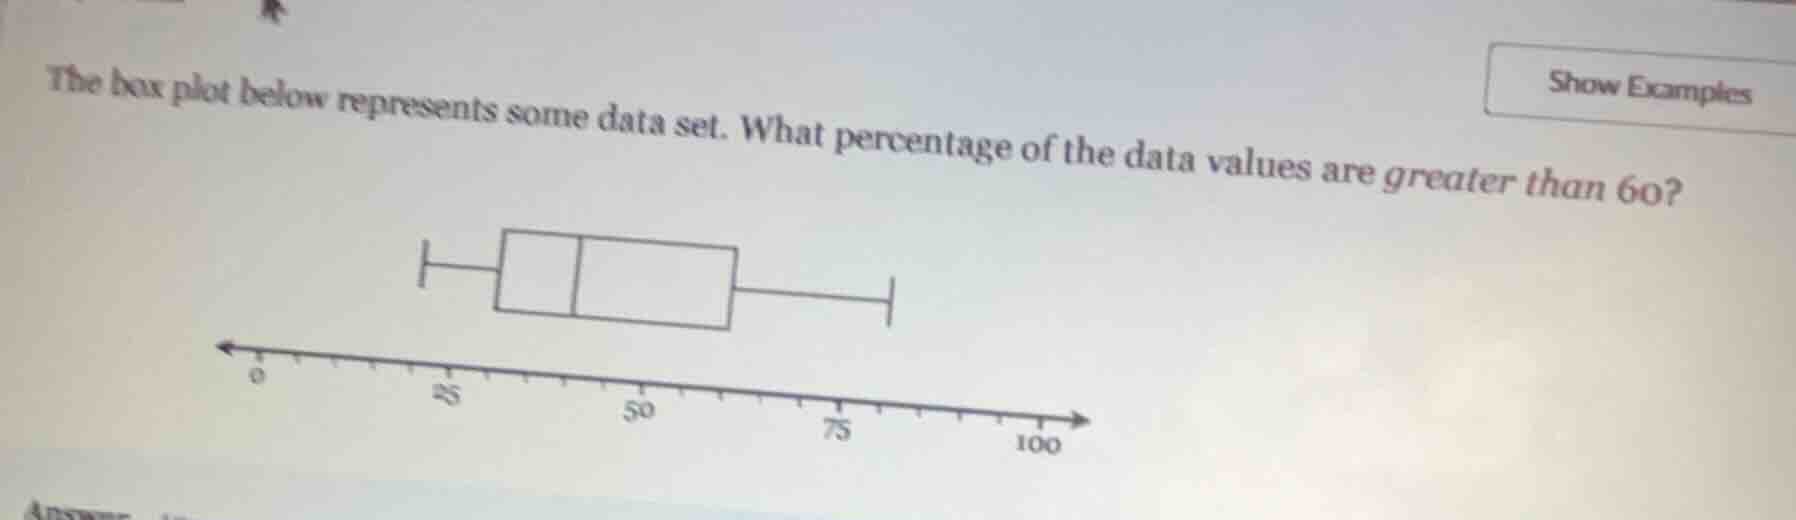
the box plot below represents some data set. what percentage of the data values are greater than 60?
show examples
Step1: Identify median at 60
The vertical line inside the box plot is at 60, which is the median (second quartile, $Q_2$) of the dataset.
Step2: Interpret median percentage
By definition, the median divides a dataset such that 50% of the data values are greater than the median.

Snap & solve any problem in the app
Get step-by-step solutions on Sovi AI
Photo-based solutions with guided steps
Explore more problems and detailed explanations
50%