QUESTION IMAGE
Question
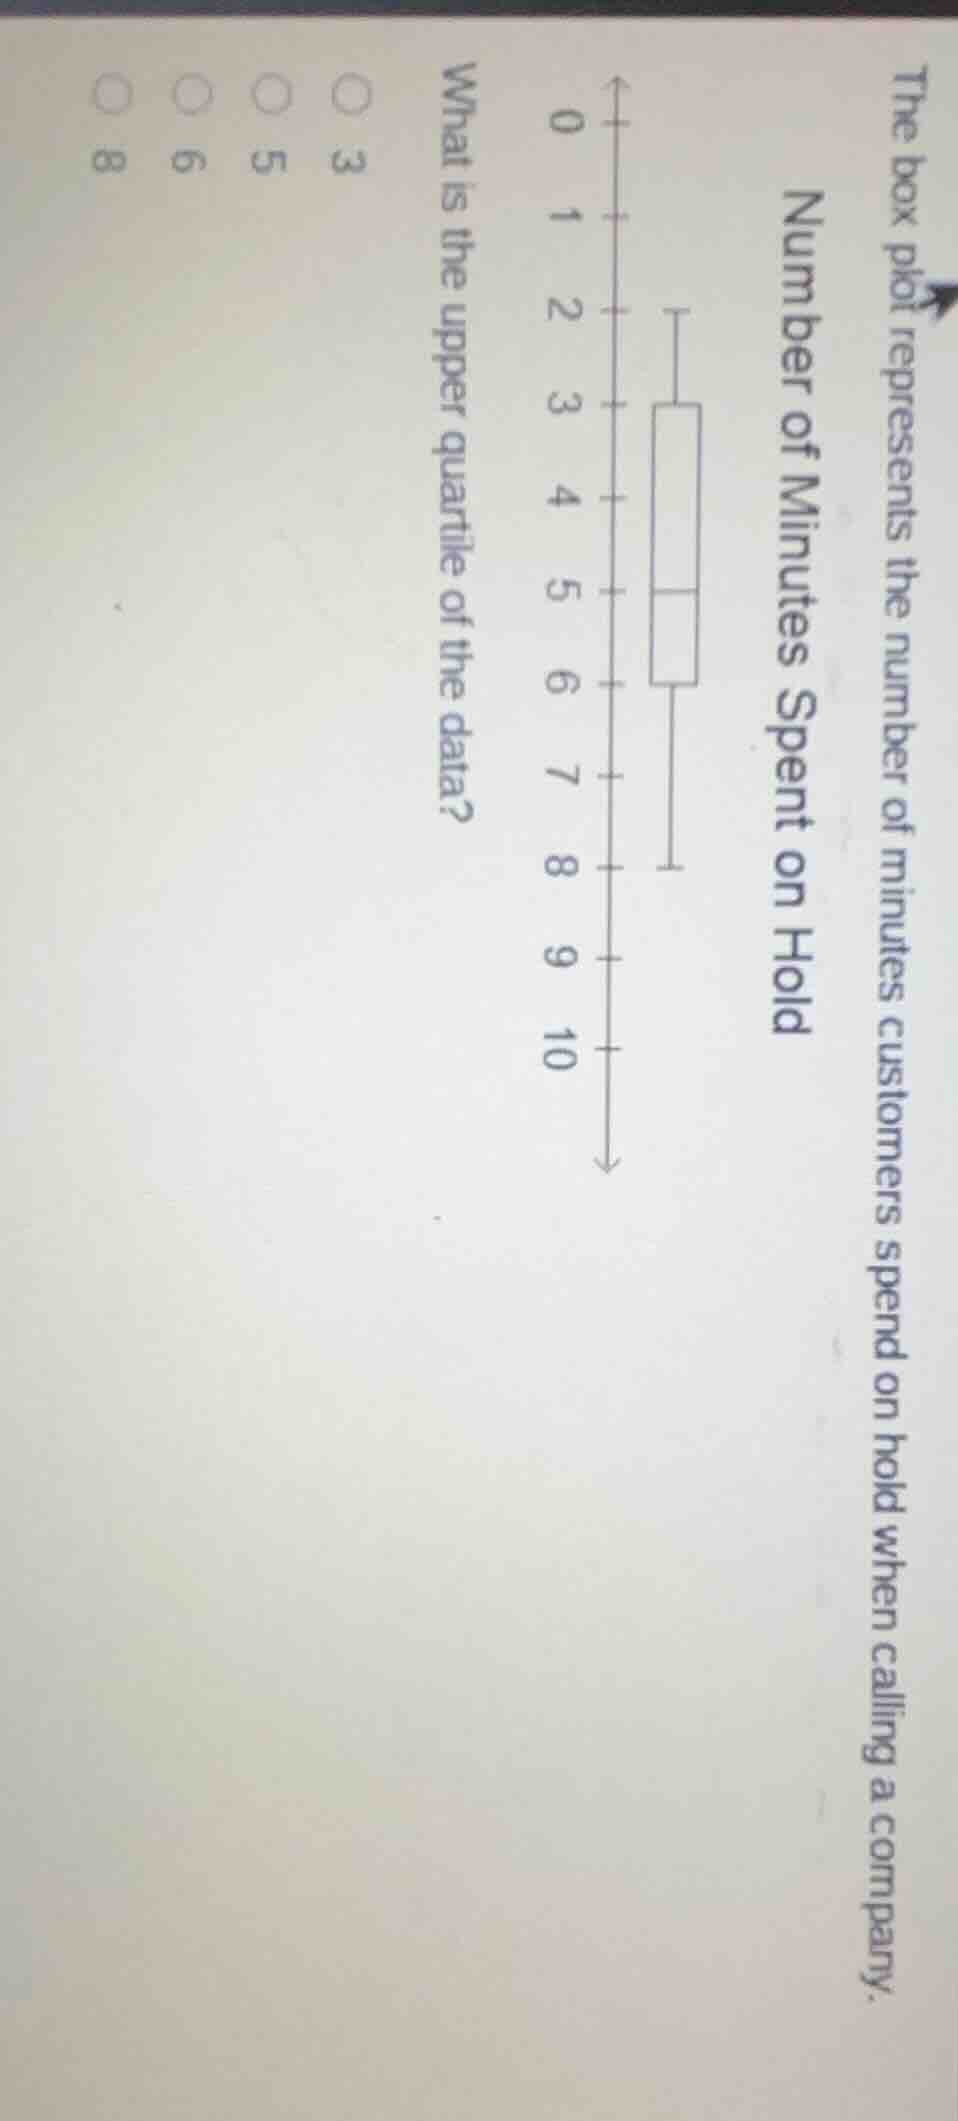
the box plot represents the number of minutes customers spend on hold when calling a company.
number of minutes spent on hold
what is the upper quartile of the data?
○ 3
○ 5
○ 6
○ 8
Step1: Identify upper quartile in box plot
In a box plot, the upper quartile ($Q_3$) is the right edge of the rectangular box.
Step2: Match to axis value
Looking at the plot, the right edge of the box aligns with the value 6 on the number line.

Snap & solve any problem in the app
Get step-by-step solutions on Sovi AI
Photo-based solutions with guided steps
Explore more problems and detailed explanations
B. 6