QUESTION IMAGE
Question
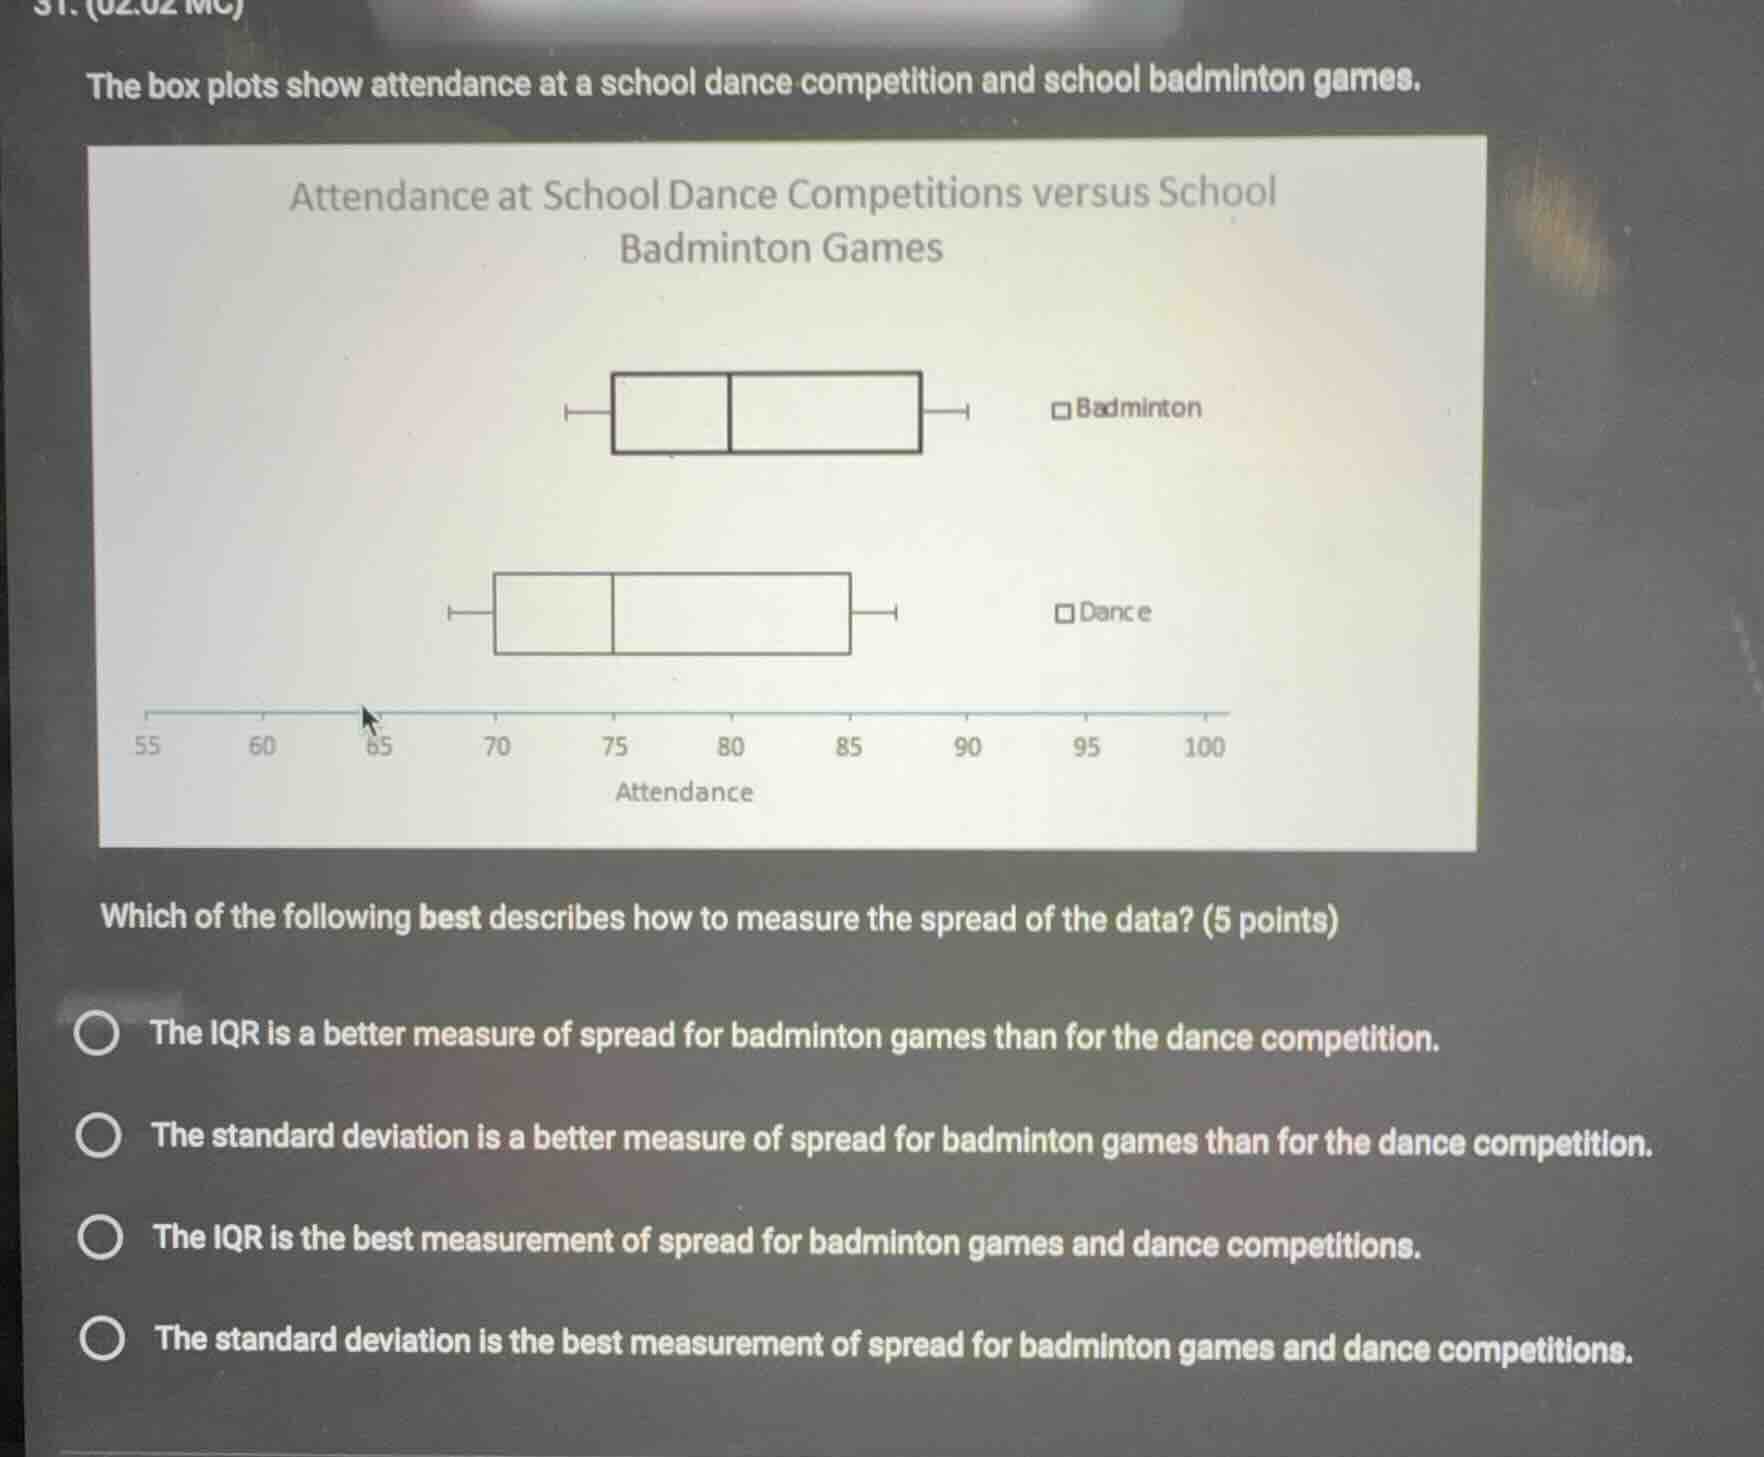
the box plots show attendance at a school dance competition and school badminton games. attendance at school dance competitions versus school badminton games (box plot image) which of the following best describes how to measure the spread of the data? (5 points) the iqr is a better measure of spread for badminton games than for the dance competition. the standard deviation is a better measure of spread for badminton games than for the dance competition. the iqr is the best measurement of spread for badminton games and dance competitions. the standard deviation is the best measurement of spread for badminton games and dance competitions.
Interquartile Range (IQR) is preferred for skewed data, while standard deviation works best for symmetric, normally distributed data. Looking at the box plots, both datasets appear symmetric (the median is centered in each box, and whiskers are roughly equal in length). For symmetric data with no outliers, standard deviation is a better measure as it uses all data points to describe spread.

Snap & solve any problem in the app
Get step-by-step solutions on Sovi AI
Photo-based solutions with guided steps
Explore more problems and detailed explanations
D. The standard deviation is the best measurement of spread for badminton games and dance competitions.