QUESTION IMAGE
Question
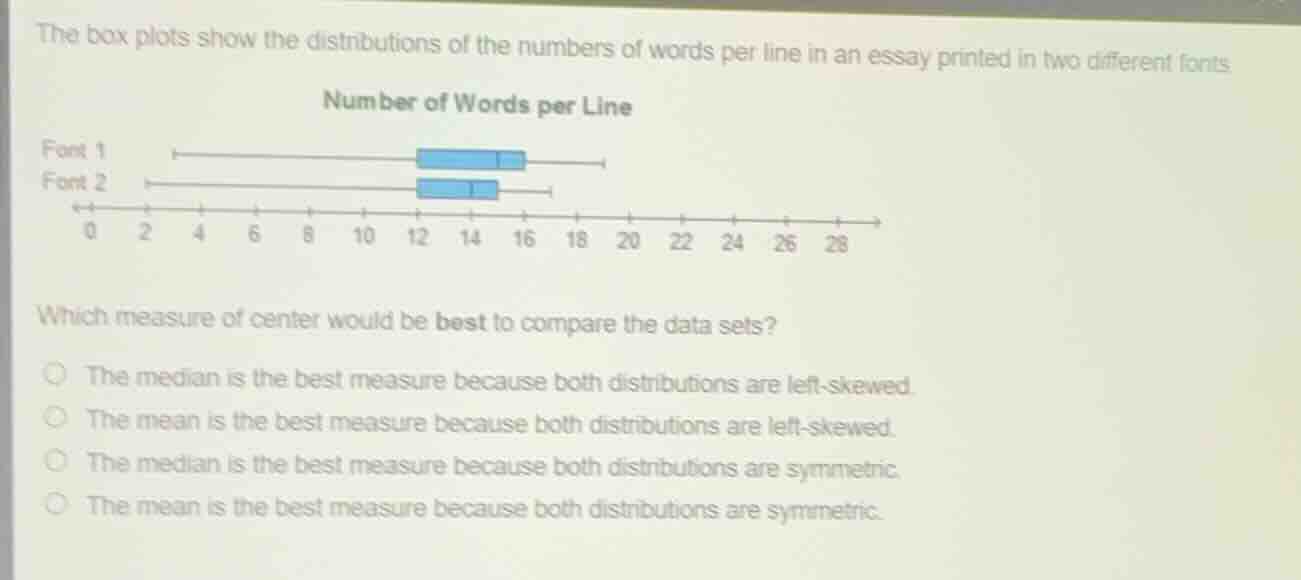
the box plots show the distributions of the numbers of words per line in an essay printed in two different fonts.
number of words per line
font 1
font 2
0 2 4 6 8 10 12 14 16 18 20 22 24 26 28
which measure of center would be best to compare the data sets?
the median is the best measure because both distributions are left - skewed.
the mean is the best measure because both distributions are left - skewed.
the median is the best measure because both distributions are symmetric.
the mean is the best measure because both distributions are symmetric.
To determine the best measure of center, we analyze the distribution shape. Skewed distributions (left - skewed here, as the tail is on the left) are better analyzed with the median because the mean is affected by extreme values (in skewed data, the mean is pulled towards the tail). The first option states the median is best because both distributions are left - skewed, which matches the reasoning. The other options are incorrect: mean is not best for skewed data, and the distributions are not symmetric.

Snap & solve any problem in the app
Get step-by-step solutions on Sovi AI
Photo-based solutions with guided steps
Explore more problems and detailed explanations
The median is the best measure because both distributions are left - skewed.