QUESTION IMAGE
Question
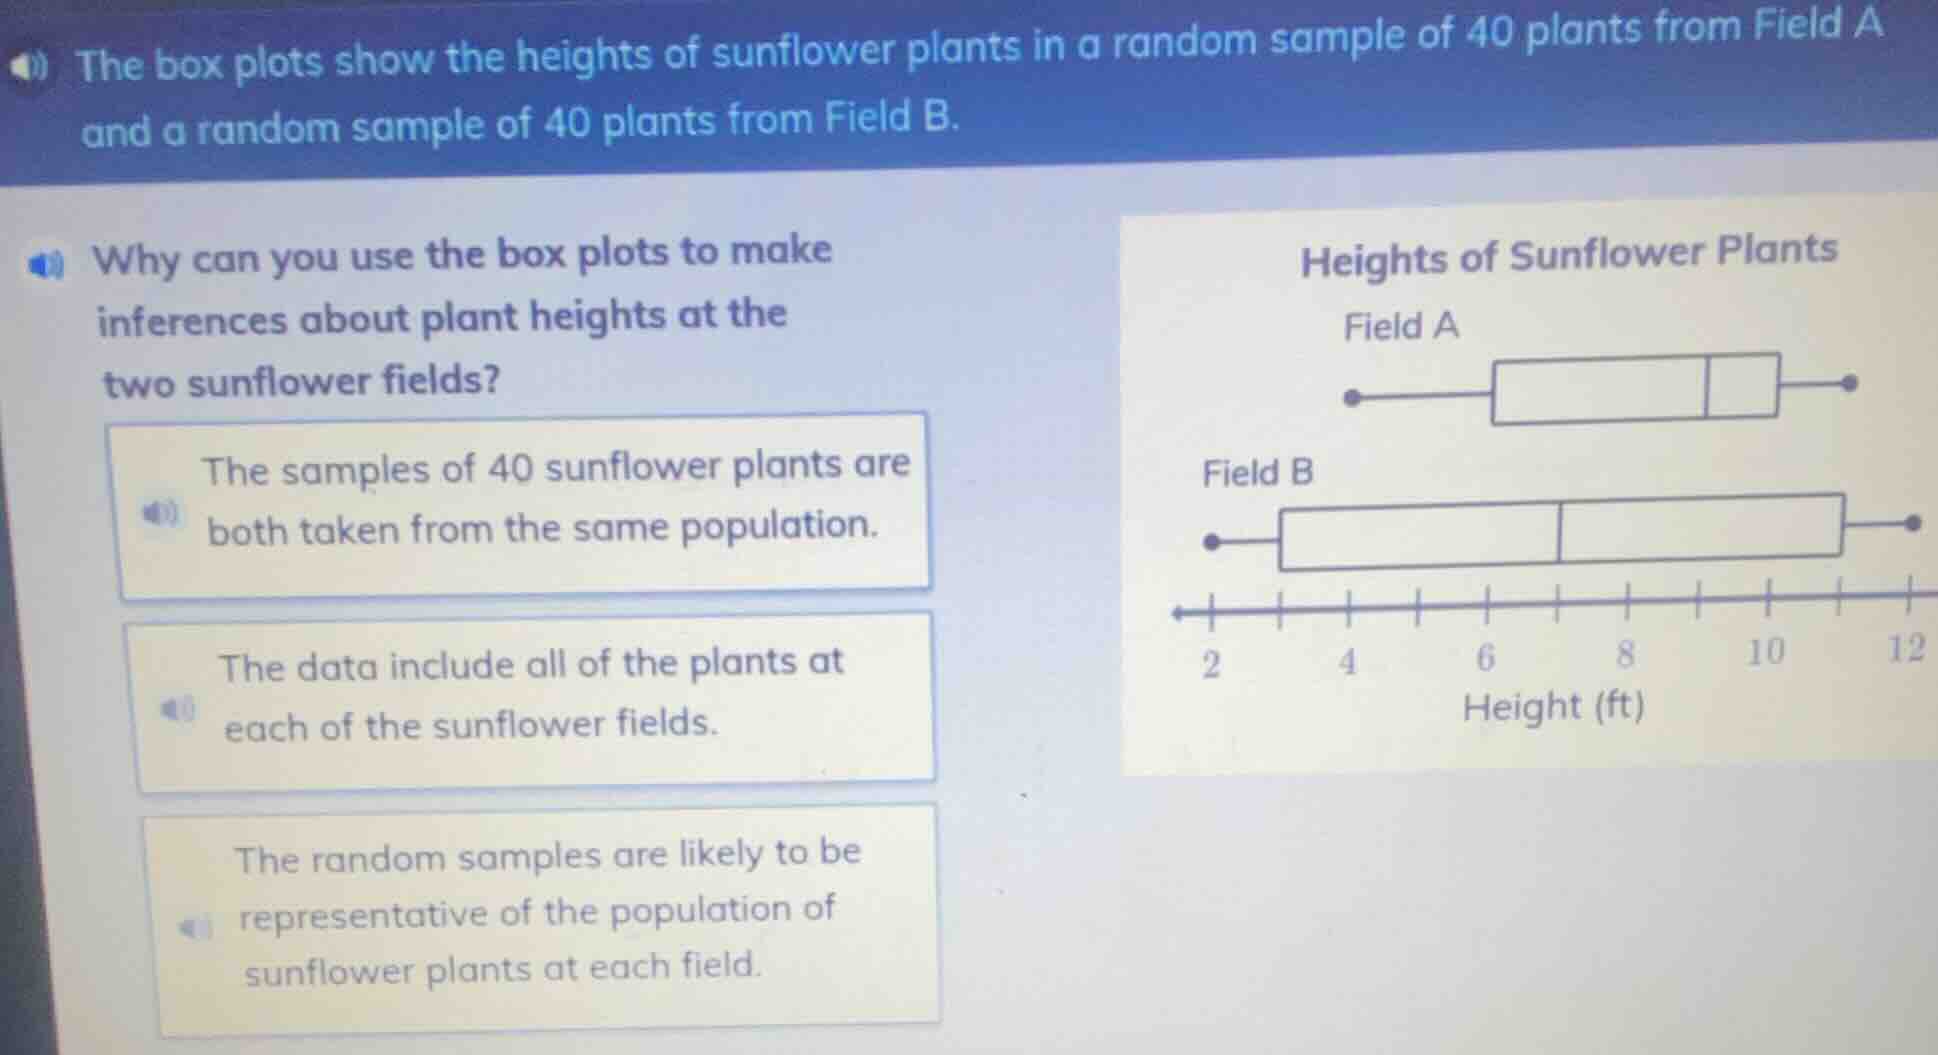
the box plots show the heights of sunflower plants in a random sample of 40 plants from field a and a random sample of 40 plants from field b. why can you use the box plots to make inferences about plant heights at the two sunflower fields? the samples of 40 sunflower plants are both taken from the same population. the data include all of the plants at each of the sunflower fields. the random samples are likely to be representative of the population of sunflower plants at each field. heights of sunflower plants field a field b 2 4 6 8 10 12 height (ft)
Box plots summarize sample data, and valid inferences about a population require the sample to reflect the population. Random samples of sufficient size (40 plants here) are statistically likely to be representative of their respective field populations, allowing us to extend conclusions from the sample data to the full fields. The other options are incorrect: the samples are from different populations (Field A and B), and the data are samples, not all plants from the fields.

Snap & solve any problem in the app
Get step-by-step solutions on Sovi AI
Photo-based solutions with guided steps
Explore more problems and detailed explanations
The random samples are likely to be representative of the population of sunflower plants at each field.