QUESTION IMAGE
Question
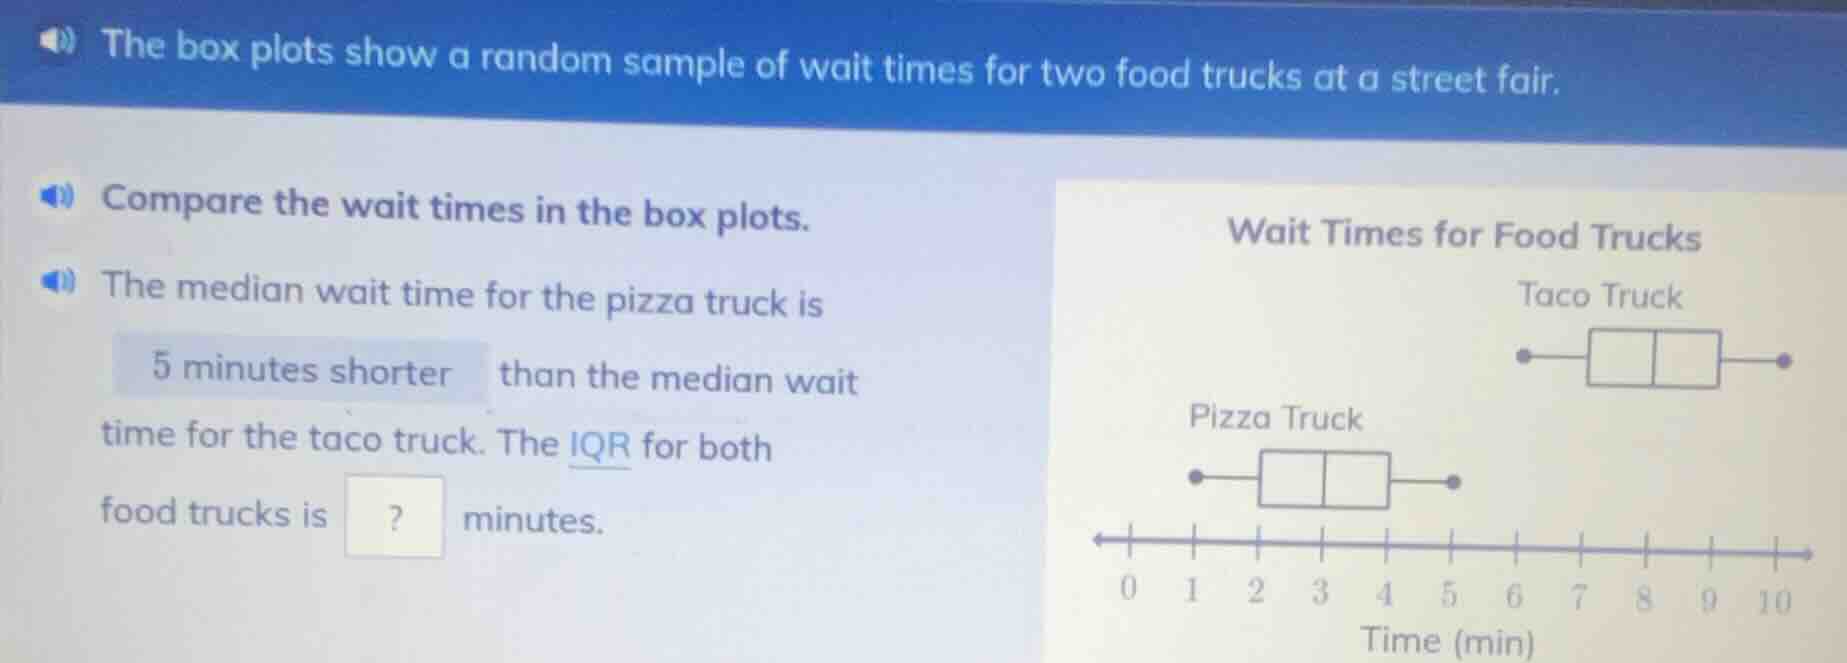
the box plots show a random sample of wait times for two food trucks at a street fair. compare the wait times in the box plots. the median wait time for the pizza truck is 5 minutes shorter than the median wait time for the taco truck. the iqr for both food trucks is? minutes. wait times for food trucks taco truck pizza truck 0 1 2 3 4 5 6 7 8 9 10 time (min)
Step1: Define IQR (Interquartile Range)
IQR = Third Quartile ($Q_3$) - First Quartile ($Q_1$)
Step2: Identify $Q_1, Q_3$ for Pizza Truck
From the box plot: $Q_1=2$, $Q_3=4$
Expression: $\text{IQR}_{\text{Pizza}} = 4 - 2 = 2$
Step3: Identify $Q_1, Q_3$ for Taco Truck
From the box plot: $Q_1=6$, $Q_3=8$
Expression: $\text{IQR}_{\text{Taco}} = 8 - 6 = 2$

Snap & solve any problem in the app
Get step-by-step solutions on Sovi AI
Photo-based solutions with guided steps
Explore more problems and detailed explanations
2