QUESTION IMAGE
Question
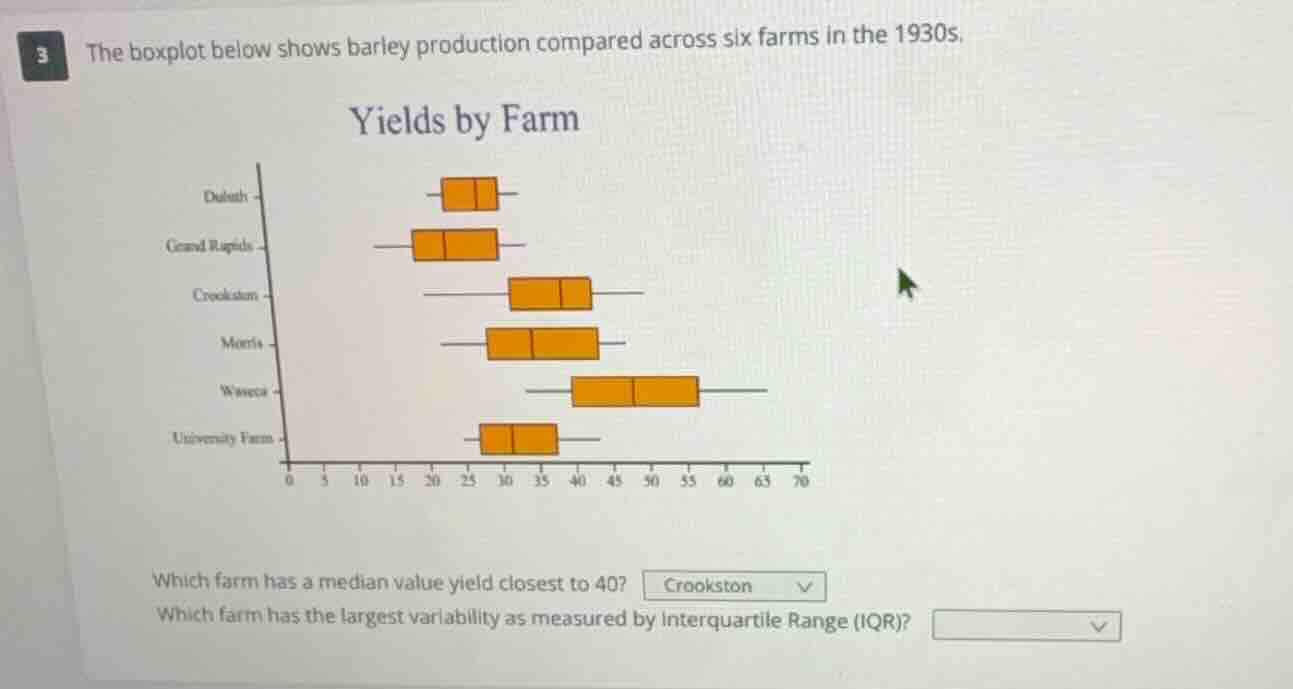
3 the boxplot below shows barley production compared across six farms in the 1930s. yields by farm deluth canal rapids crookston morris waseca university farm 0 5 10 15 20 25 30 35 40 45 50 55 60 63 70 which farm has a median value yield closest to 40? crookston which farm has the largest variability as measured by interquartile range (iqr)?
Response
To determine which farm has the largest variability as measured by the Interquartile Range (IQR), we analyze the boxplots:
- The IQR of a boxplot is the length of the box (from the first quartile \( Q_1 \) to the third quartile \( Q_3 \), so \( \text{IQR} = Q_3 - Q_1 \)). A longer box indicates a larger IQR (more variability in the middle 50% of the data).
- Visually inspecting the boxplots:
- Delath: Short box.
- Grand Rapids: Moderate box.
- Crookston: Moderate box.
- Morris: Moderate box.
- Waseca: The longest box (spanning the most horizontal distance).
- University Farm: Short box.
Thus, the farm with the largest IQR (most variability) is Waseca.

Snap & solve any problem in the app
Get step-by-step solutions on Sovi AI
Photo-based solutions with guided steps
Explore more problems and detailed explanations
Waseca