QUESTION IMAGE
Question
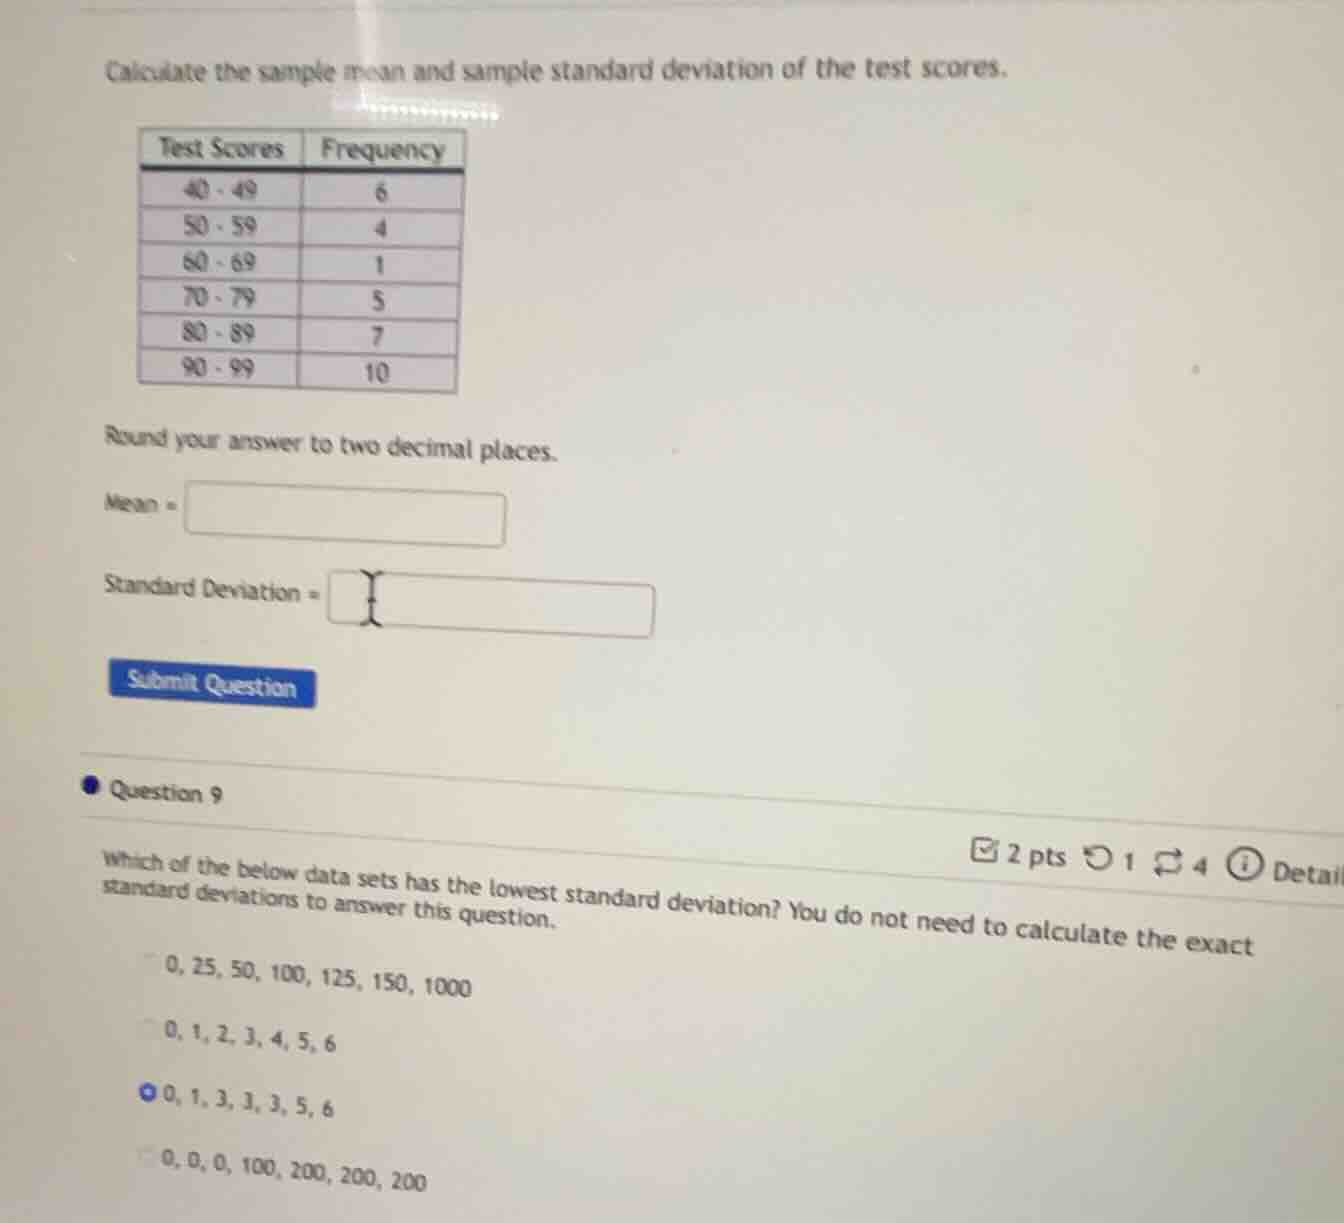
calculate the sample mean and sample standard deviation of the test scores.
test scores frequency
40 - 49 6
50 - 59 4
60 - 69 1
70 - 79 5
80 - 89 7
90 - 99 10
round your answer to two decimal places.
mean =
standard deviation =
submit question
question 9
2 pts 1 4 detail
which of the below data sets has the lowest standard deviation? you do not need to calculate the exact standard deviations to answer this question.
0, 25, 50, 100, 125, 150, 1000
0, 1, 2, 3, 4, 5, 6
0, 1, 3, 3, 3, 5, 6
0, 0, 0, 100, 200, 200, 200
Part 1: Calculate Sample Mean and Sample Standard Deviation of Test Scores
Step 1: Find Midpoints of Each Class Interval
- For \( 40 - 49 \): Midpoint \( x_1 = \frac{40 + 49}{2} = 44.5 \)
- For \( 50 - 59 \): Midpoint \( x_2 = \frac{50 + 59}{2} = 54.5 \)
- For \( 60 - 69 \): Midpoint \( x_3 = \frac{60 + 69}{2} = 64.5 \)
- For \( 70 - 79 \): Midpoint \( x_4 = \frac{70 + 79}{2} = 74.5 \)
- For \( 80 - 89 \): Midpoint \( x_5 = \frac{80 + 89}{2} = 84.5 \)
- For \( 90 - 99 \): Midpoint \( x_6 = \frac{90 + 99}{2} = 94.5 \)
Step 2: Calculate \( f_i x_i \) (Product of Frequency and Midpoint)
- \( f_1 x_1 = 6 \times 44.5 = 267 \)
- \( f_2 x_2 = 4 \times 54.5 = 218 \)
- \( f_3 x_3 = 1 \times 64.5 = 64.5 \)
- \( f_4 x_4 = 5 \times 74.5 = 372.5 \)
- \( f_5 x_5 = 7 \times 84.5 = 591.5 \)
- \( f_6 x_6 = 10 \times 94.5 = 945 \)
Step 3: Calculate Total Frequency (\( N \)) and Total \( f_i x_i \)
- \( N = 6 + 4 + 1 + 5 + 7 + 10 = 33 \)
- \( \sum f_i x_i = 267 + 218 + 64.5 + 372.5 + 591.5 + 945 = 2458.5 \)
Step 4: Calculate Sample Mean (\( \bar{x} \))
The formula for the mean of grouped data is \( \bar{x} = \frac{\sum f_i x_i}{N} \)
\[
\bar{x} = \frac{2458.5}{33} \approx 74.50
\]
Step 5: Calculate \( f_i (x_i - \bar{x})^2 \) (Sum of Squared Deviations Weighted by Frequency)
- For \( x_1 = 44.5 \): \( (44.5 - 74.5)^2 = (-30)^2 = 900 \), \( f_1 (x_1 - \bar{x})^2 = 6 \times 900 = 5400 \)
- For \( x_2 = 54.5 \): \( (54.5 - 74.5)^2 = (-20)^2 = 400 \), \( f_2 (x_2 - \bar{x})^2 = 4 \times 400 = 1600 \)
- For \( x_3 = 64.5 \): \( (64.5 - 74.5)^2 = (-10)^2 = 100 \), \( f_3 (x_3 - \bar{x})^2 = 1 \times 100 = 100 \)
- For \( x_4 = 74.5 \): \( (74.5 - 74.5)^2 = 0^2 = 0 \), \( f_4 (x_4 - \bar{x})^2 = 5 \times 0 = 0 \)
- For \( x_5 = 84.5 \): \( (84.5 - 74.5)^2 = (10)^2 = 100 \), \( f_5 (x_5 - \bar{x})^2 = 7 \times 100 = 700 \)
- For \( x_6 = 94.5 \): \( (94.5 - 74.5)^2 = (20)^2 = 400 \), \( f_6 (x_6 - \bar{x})^2 = 10 \times 400 = 4000 \)
Step 6: Calculate Sum of Squared Deviations (\( \sum f_i (x_i - \bar{x})^2 \))
\[
\sum f_i (x_i - \bar{x})^2 = 5400 + 1600 + 100 + 0 + 700 + 4000 = 11800
\]
Step 7: Calculate Sample Variance (\( s^2 \))
The formula for sample variance of grouped data is \( s^2 = \frac{\sum f_i (x_i - \bar{x})^2}{N - 1} \)
\[
s^2 = \frac{11800}{33 - 1} = \frac{11800}{32} = 368.75
\]
Step 8: Calculate Sample Standard Deviation (\( s \))
The standard deviation is the square root of the variance: \( s = \sqrt{s^2} \)
\[
s = \sqrt{368.75} \approx 19.20
\]
Part 2: Identify Data Set with Lowest Standard Deviation
Standard deviation measures the spread of data. A smaller standard deviation means data points are closer to the mean.
- Data Set 1: \( 0, 25, 50, 100, 125, 150, 1000 \) – Has a large outlier (1000), so spread is large.
- Data Set 2: \( 0, 1, 2, 3, 4, 5, 6 \) – Data points are consecutive integers, spread is moderate.
- Data Set 3: \( 0, 1, 3, 3, 3, 5, 6 \) – Most data points (three 3s) are clustered around the middle, reducing spread.
- Data Set 4: \( 0, 0, 0, 100, 200, 200, 200 \) – Has two distinct clusters (0s and 200s), spread is large.
Among these, Data Set 3 has the most clustered values (three 3s), so it has the lowest standard deviation.
Final Answers
Part 1:
- Mean: \( \boxed{74.50} \)
- Standard Deviation: \( \boxed{19.20} \)
Part 2:
The data set with the lowest standard deviation is \( \boldsymbol{0, 1, 3, 3, 3, 5, 6} \) (the third option).

Snap & solve any problem in the app
Get step-by-step solutions on Sovi AI
Photo-based solutions with guided steps
Explore more problems and detailed explanations
Part 1: Calculate Sample Mean and Sample Standard Deviation of Test Scores
Step 1: Find Midpoints of Each Class Interval
- For \( 40 - 49 \): Midpoint \( x_1 = \frac{40 + 49}{2} = 44.5 \)
- For \( 50 - 59 \): Midpoint \( x_2 = \frac{50 + 59}{2} = 54.5 \)
- For \( 60 - 69 \): Midpoint \( x_3 = \frac{60 + 69}{2} = 64.5 \)
- For \( 70 - 79 \): Midpoint \( x_4 = \frac{70 + 79}{2} = 74.5 \)
- For \( 80 - 89 \): Midpoint \( x_5 = \frac{80 + 89}{2} = 84.5 \)
- For \( 90 - 99 \): Midpoint \( x_6 = \frac{90 + 99}{2} = 94.5 \)
Step 2: Calculate \( f_i x_i \) (Product of Frequency and Midpoint)
- \( f_1 x_1 = 6 \times 44.5 = 267 \)
- \( f_2 x_2 = 4 \times 54.5 = 218 \)
- \( f_3 x_3 = 1 \times 64.5 = 64.5 \)
- \( f_4 x_4 = 5 \times 74.5 = 372.5 \)
- \( f_5 x_5 = 7 \times 84.5 = 591.5 \)
- \( f_6 x_6 = 10 \times 94.5 = 945 \)
Step 3: Calculate Total Frequency (\( N \)) and Total \( f_i x_i \)
- \( N = 6 + 4 + 1 + 5 + 7 + 10 = 33 \)
- \( \sum f_i x_i = 267 + 218 + 64.5 + 372.5 + 591.5 + 945 = 2458.5 \)
Step 4: Calculate Sample Mean (\( \bar{x} \))
The formula for the mean of grouped data is \( \bar{x} = \frac{\sum f_i x_i}{N} \)
\[
\bar{x} = \frac{2458.5}{33} \approx 74.50
\]
Step 5: Calculate \( f_i (x_i - \bar{x})^2 \) (Sum of Squared Deviations Weighted by Frequency)
- For \( x_1 = 44.5 \): \( (44.5 - 74.5)^2 = (-30)^2 = 900 \), \( f_1 (x_1 - \bar{x})^2 = 6 \times 900 = 5400 \)
- For \( x_2 = 54.5 \): \( (54.5 - 74.5)^2 = (-20)^2 = 400 \), \( f_2 (x_2 - \bar{x})^2 = 4 \times 400 = 1600 \)
- For \( x_3 = 64.5 \): \( (64.5 - 74.5)^2 = (-10)^2 = 100 \), \( f_3 (x_3 - \bar{x})^2 = 1 \times 100 = 100 \)
- For \( x_4 = 74.5 \): \( (74.5 - 74.5)^2 = 0^2 = 0 \), \( f_4 (x_4 - \bar{x})^2 = 5 \times 0 = 0 \)
- For \( x_5 = 84.5 \): \( (84.5 - 74.5)^2 = (10)^2 = 100 \), \( f_5 (x_5 - \bar{x})^2 = 7 \times 100 = 700 \)
- For \( x_6 = 94.5 \): \( (94.5 - 74.5)^2 = (20)^2 = 400 \), \( f_6 (x_6 - \bar{x})^2 = 10 \times 400 = 4000 \)
Step 6: Calculate Sum of Squared Deviations (\( \sum f_i (x_i - \bar{x})^2 \))
\[
\sum f_i (x_i - \bar{x})^2 = 5400 + 1600 + 100 + 0 + 700 + 4000 = 11800
\]
Step 7: Calculate Sample Variance (\( s^2 \))
The formula for sample variance of grouped data is \( s^2 = \frac{\sum f_i (x_i - \bar{x})^2}{N - 1} \)
\[
s^2 = \frac{11800}{33 - 1} = \frac{11800}{32} = 368.75
\]
Step 8: Calculate Sample Standard Deviation (\( s \))
The standard deviation is the square root of the variance: \( s = \sqrt{s^2} \)
\[
s = \sqrt{368.75} \approx 19.20
\]
Part 2: Identify Data Set with Lowest Standard Deviation
Standard deviation measures the spread of data. A smaller standard deviation means data points are closer to the mean.
- Data Set 1: \( 0, 25, 50, 100, 125, 150, 1000 \) – Has a large outlier (1000), so spread is large.
- Data Set 2: \( 0, 1, 2, 3, 4, 5, 6 \) – Data points are consecutive integers, spread is moderate.
- Data Set 3: \( 0, 1, 3, 3, 3, 5, 6 \) – Most data points (three 3s) are clustered around the middle, reducing spread.
- Data Set 4: \( 0, 0, 0, 100, 200, 200, 200 \) – Has two distinct clusters (0s and 200s), spread is large.
Among these, Data Set 3 has the most clustered values (three 3s), so it has the lowest standard deviation.
Final Answers
Part 1:
- Mean: \( \boxed{74.50} \)
- Standard Deviation: \( \boxed{19.20} \)
Part 2:
The data set with the lowest standard deviation is \( \boldsymbol{0, 1, 3, 3, 3, 5, 6} \) (the third option).