QUESTION IMAGE
Question
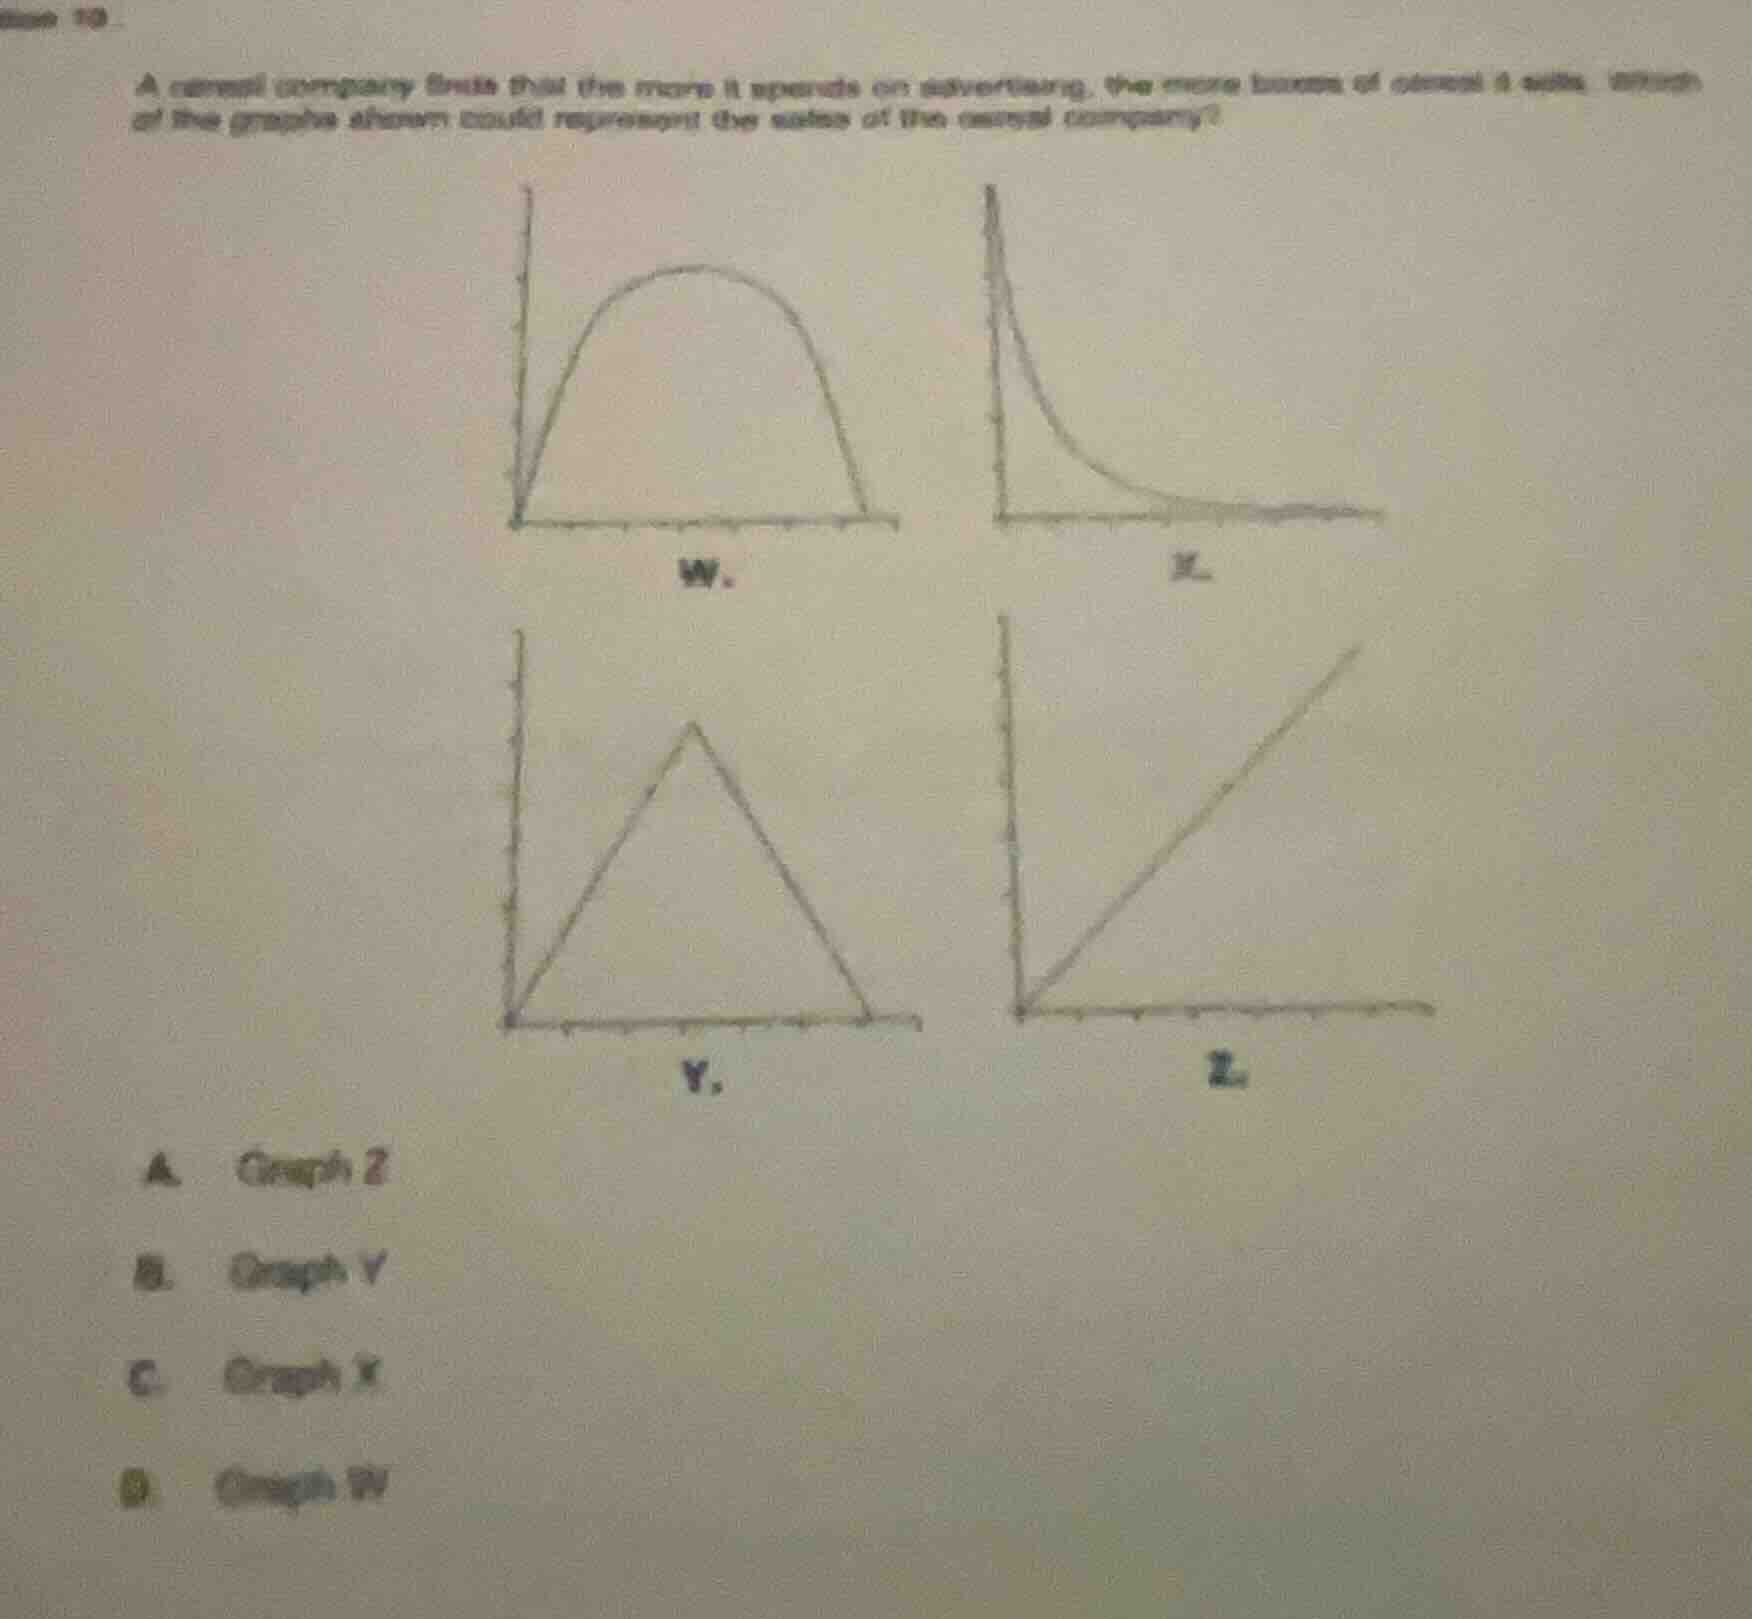
a cereal company finds that the more it spends on advertising, the more boxes of cereal it sells. which of the graphs shown could represent the sales of the cereal company?
a. graph z
b. graph y
c. graph x
d. graph w
Brief Explanations
The problem states that more advertising spending leads to more cereal sales, meaning sales (y-axis) increase as advertising (x-axis) increases.
- Graph W: Rises then falls, so sales decrease after a point, which contradicts the given relationship.
- Graph X: Falls then flattens, sales decrease with more advertising, which is incorrect.
- Graph Y: Rises then falls sharply, sales drop after a peak, which is not matching.
- Graph Z: Shows a steady, continuous increase in sales as advertising spending increases, which aligns with the problem's description.

Snap & solve any problem in the app
Get step-by-step solutions on Sovi AI
Photo-based solutions with guided steps
Explore more problems and detailed explanations
A. Graph Z