QUESTION IMAGE
Question
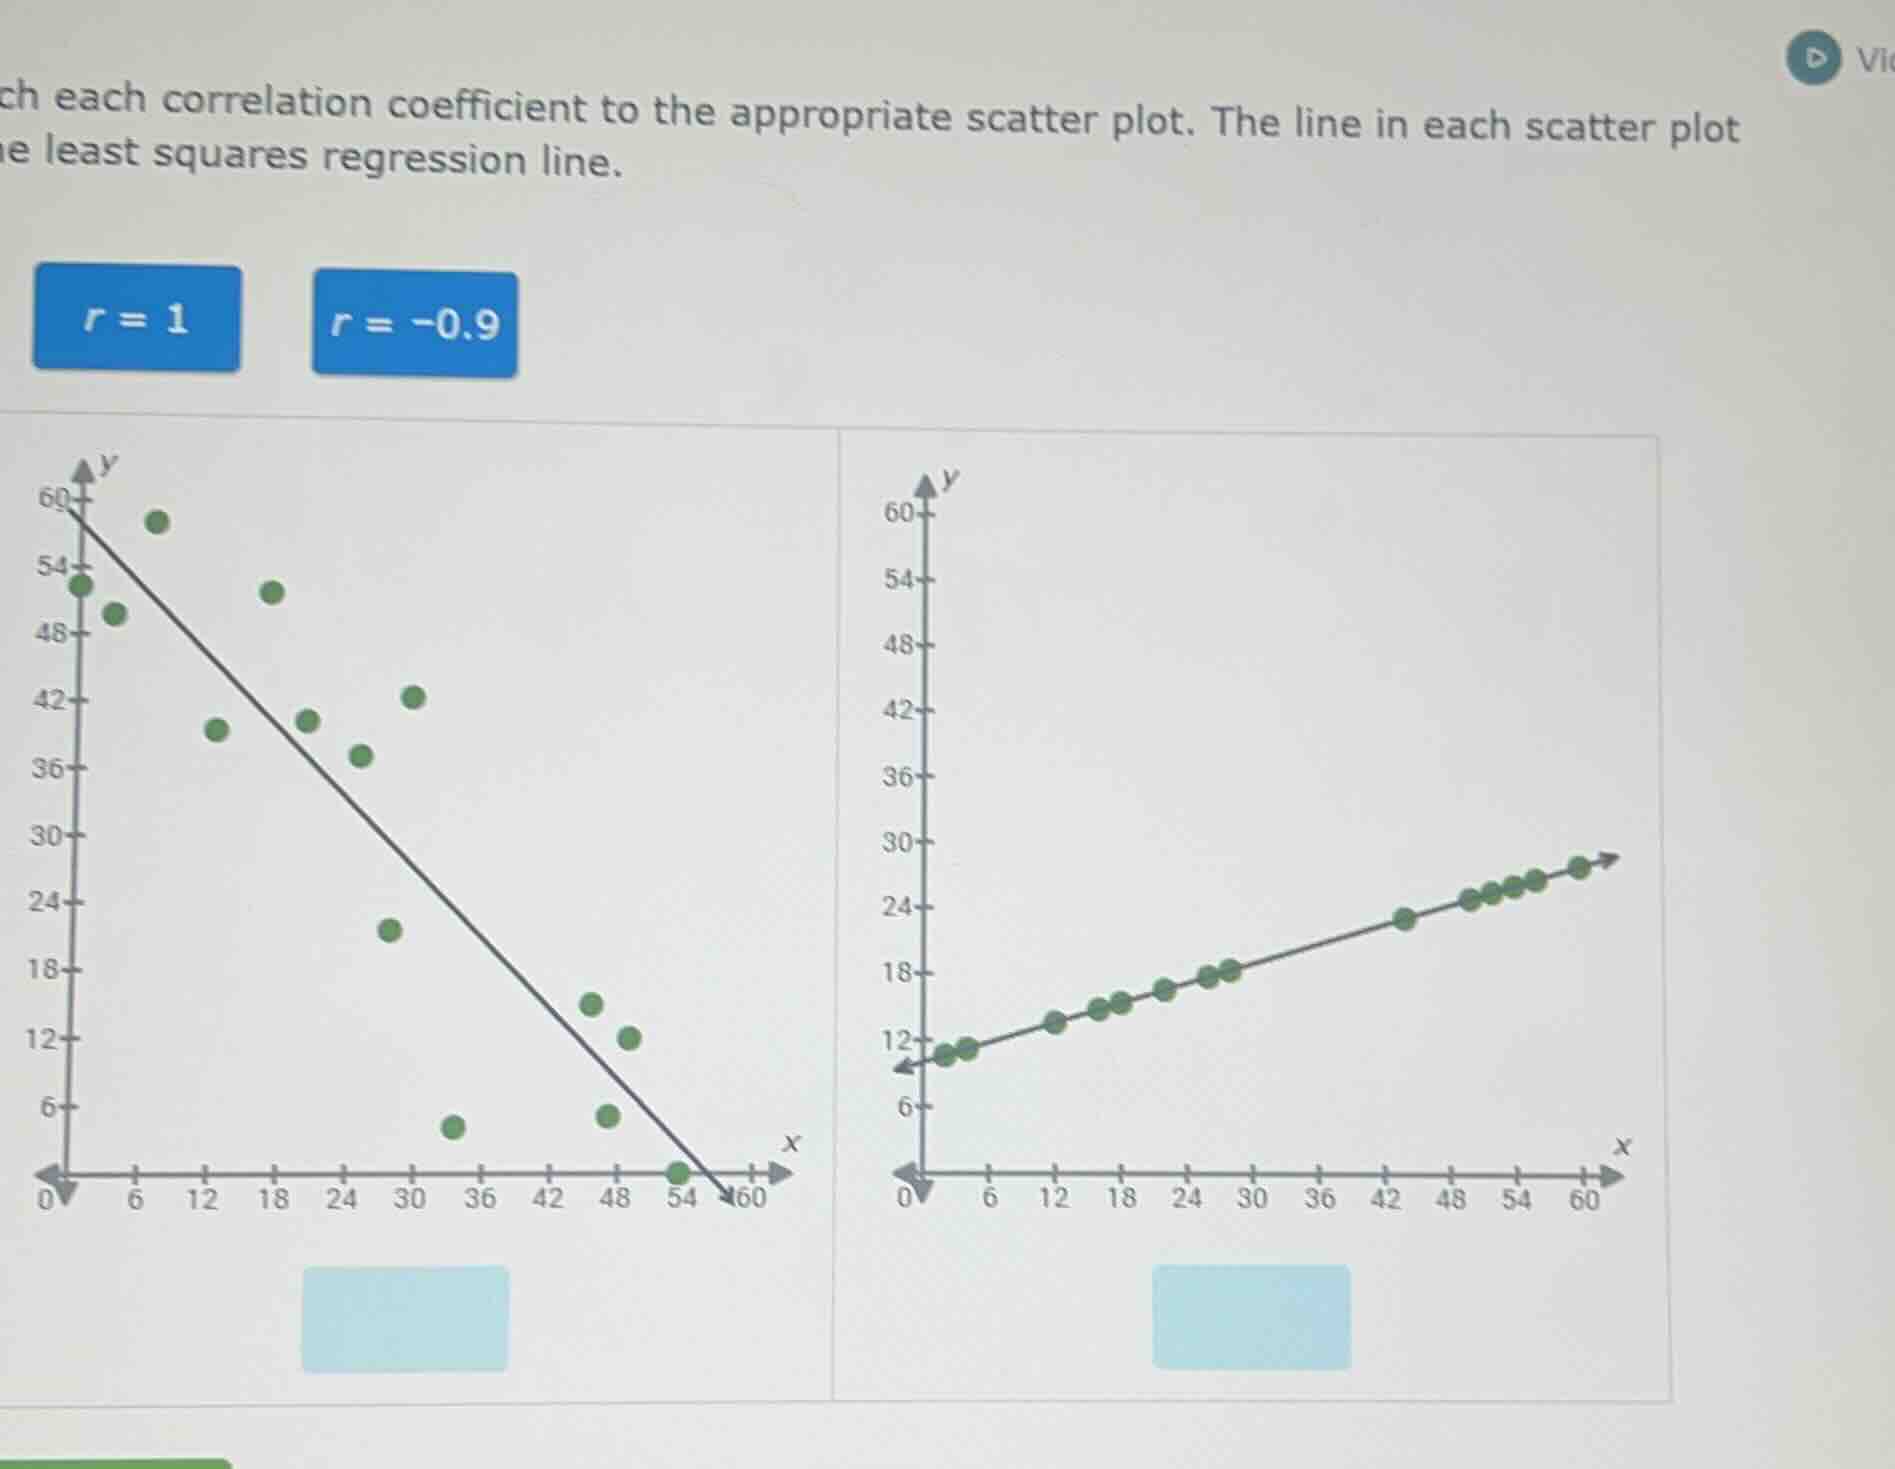
ch each correlation coefficient to the appropriate scatter plot. the line in each scatter plot he least squares regression line.
r = 1
r = -0.9
Brief Explanations
- For \(r = 1\): This represents a perfect positive linear correlation, where all data points lie exactly on an upward-sloping regression line. The right scatter plot matches this, as all points align perfectly with the increasing line.
- For \(r = -0.9\): This represents a strong negative linear correlation, where data points cluster closely around a downward-sloping regression line (not all points lie exactly on the line, as \(r\) is not -1). The left scatter plot matches this, as points follow the decreasing line closely but not perfectly.

Snap & solve any problem in the app
Get step-by-step solutions on Sovi AI
Photo-based solutions with guided steps
Explore more problems and detailed explanations
- Left scatter plot: \(r = -0.9\)
- Right scatter plot: \(r = 1\)