QUESTION IMAGE
Question
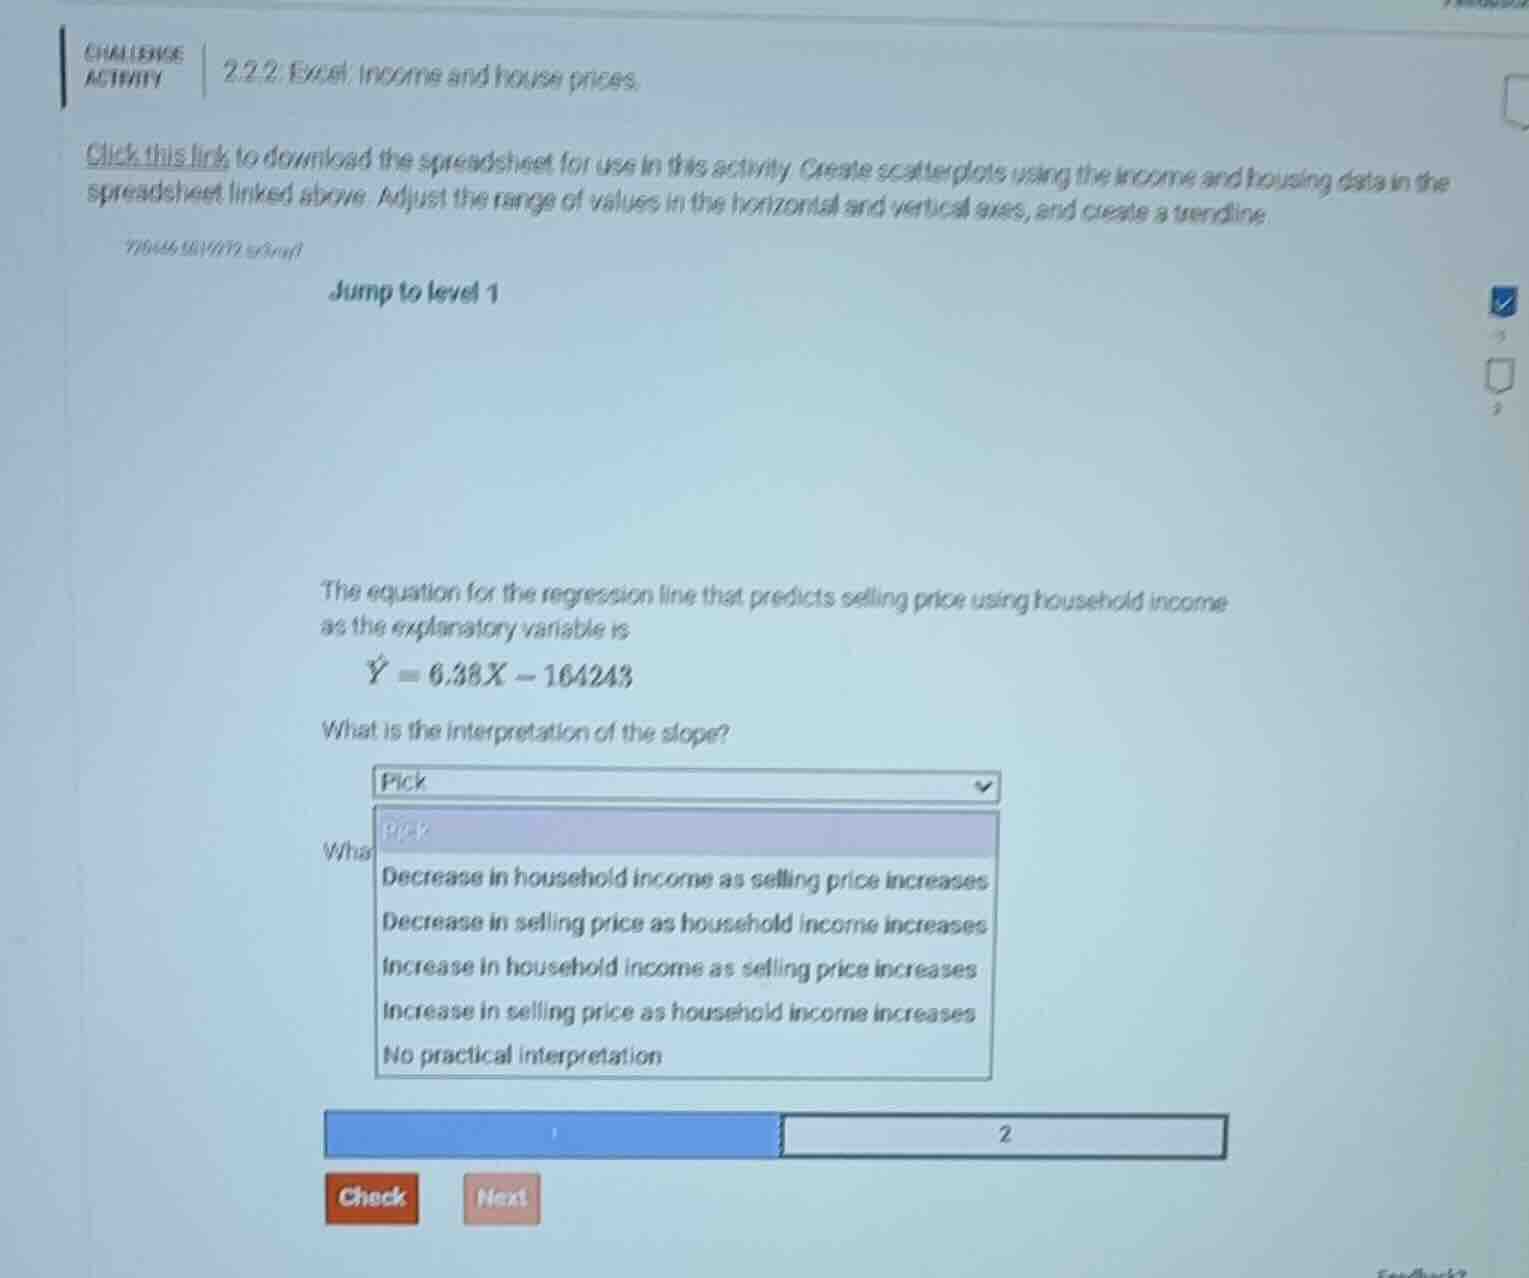
challenge activity 2.2.2: excel: income and house prices. click this link to download the spreadsheet for use in this activity. create scatterplots using the income and housing data in the spreadsheet linked above. adjust the range of values in the horizontal and vertical axes, and create a trendline. jump to level 1 the equation for the regression line that predicts selling price using household income as the explanatory variable is \\( \hat{y} = 6.38x - 164243 \\) what is the interpretation of the slope? pick decrease in household income as selling price increases decrease in selling price as household income increases increase in household income as selling price increases increase in selling price as household income increases no practical interpretation
The regression equation is $\hat{Y} = 6.38X - 164243$, where $\hat{Y}$ is predicted selling price (response variable) and $X$ is household income (explanatory variable). The slope is positive (+6.38), meaning for each 1-unit increase in $X$ (household income), $\hat{Y}$ (selling price) increases by 6.38 units.

Snap & solve any problem in the app
Get step-by-step solutions on Sovi AI
Photo-based solutions with guided steps
Explore more problems and detailed explanations
Increase in selling price as household income increases