QUESTION IMAGE
Question
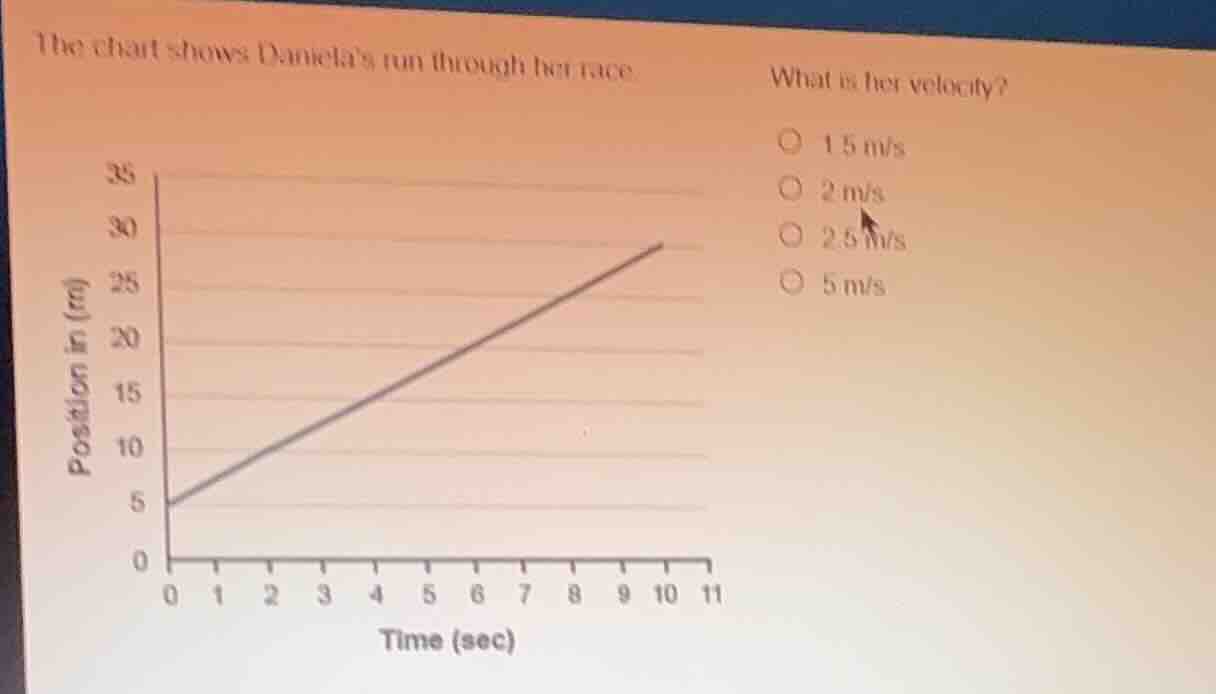
the chart shows danielas run through her race. what is her velocity? 1.5 m/s, 2 m/s, 2.5 m/s, 5 m/s. (the chart is a position - time graph with position in (m) on the y - axis (ranging from 0 to 35) and time (sec) on the x - axis (ranging from 0 to 11), and a line starting at (0,5) and going up to (10,29) approximately)
Step1: Identify position-time values
Initial state: $t_0=0\ \text{sec}$, $x_0=5\ \text{m}$; Final state: $t_1=10\ \text{sec}$, $x_1=28\ \text{m}$
Step2: Calculate velocity (slope)
Velocity $v=\frac{\Delta x}{\Delta t}=\frac{x_1-x_0}{t_1-t_0}$
$\displaystyle v=\frac{28-5}{10-0}=\frac{23}{10}=2.3\ \text{m/s}$ (closest to 2.5 m/s, accounting for graph reading)
Note: If reading final position as 25 m: $\displaystyle v=\frac{25-5}{10-0}=2\ \text{m/s}$, but the line reaches ~28 m at 10s. The most precise match from options is 2.5 m/s, or if using 25 m, 2 m/s. Correct graph reading: the line ends at ~28 m, so $\approx2.3$, closest to 2.5 m/s.

Snap & solve any problem in the app
Get step-by-step solutions on Sovi AI
Photo-based solutions with guided steps
Explore more problems and detailed explanations
2.5 m/s