QUESTION IMAGE
Question
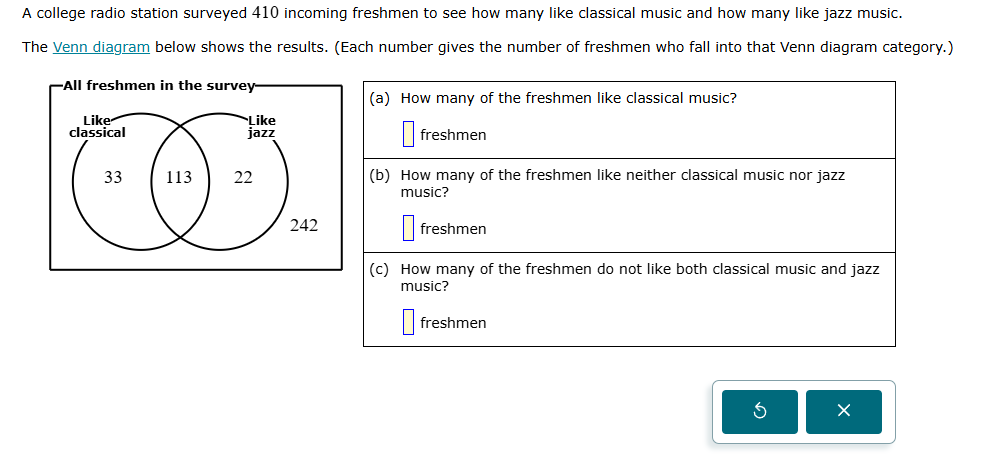
a college radio station surveyed 410 incoming freshmen to see how many like classical music and how many like jazz music. the venn diagram below shows the results. (each number gives the number of freshmen who fall into that venn diagram category.) (a) how many of the freshmen like classical music? \\(\square\\) freshmen (b) how many of the freshmen like neither classical music nor jazz music? \\(\square\\) freshmen (c) how many of the freshmen do not like both classical music and jazz music? \\(\square\\) freshmen
Step1: Sum classical-only + both
$33 + 113 = 146$
Step2: Read non-overlapping outside value
Value given: $242$
Step3: Sum non-both categories
$33 + 22 + 242 = 297$

Snap & solve any problem in the app
Get step-by-step solutions on Sovi AI
Photo-based solutions with guided steps
Explore more problems and detailed explanations
(a) 146 freshmen
(b) 242 freshmen
(c) 297 freshmen