QUESTION IMAGE
Question
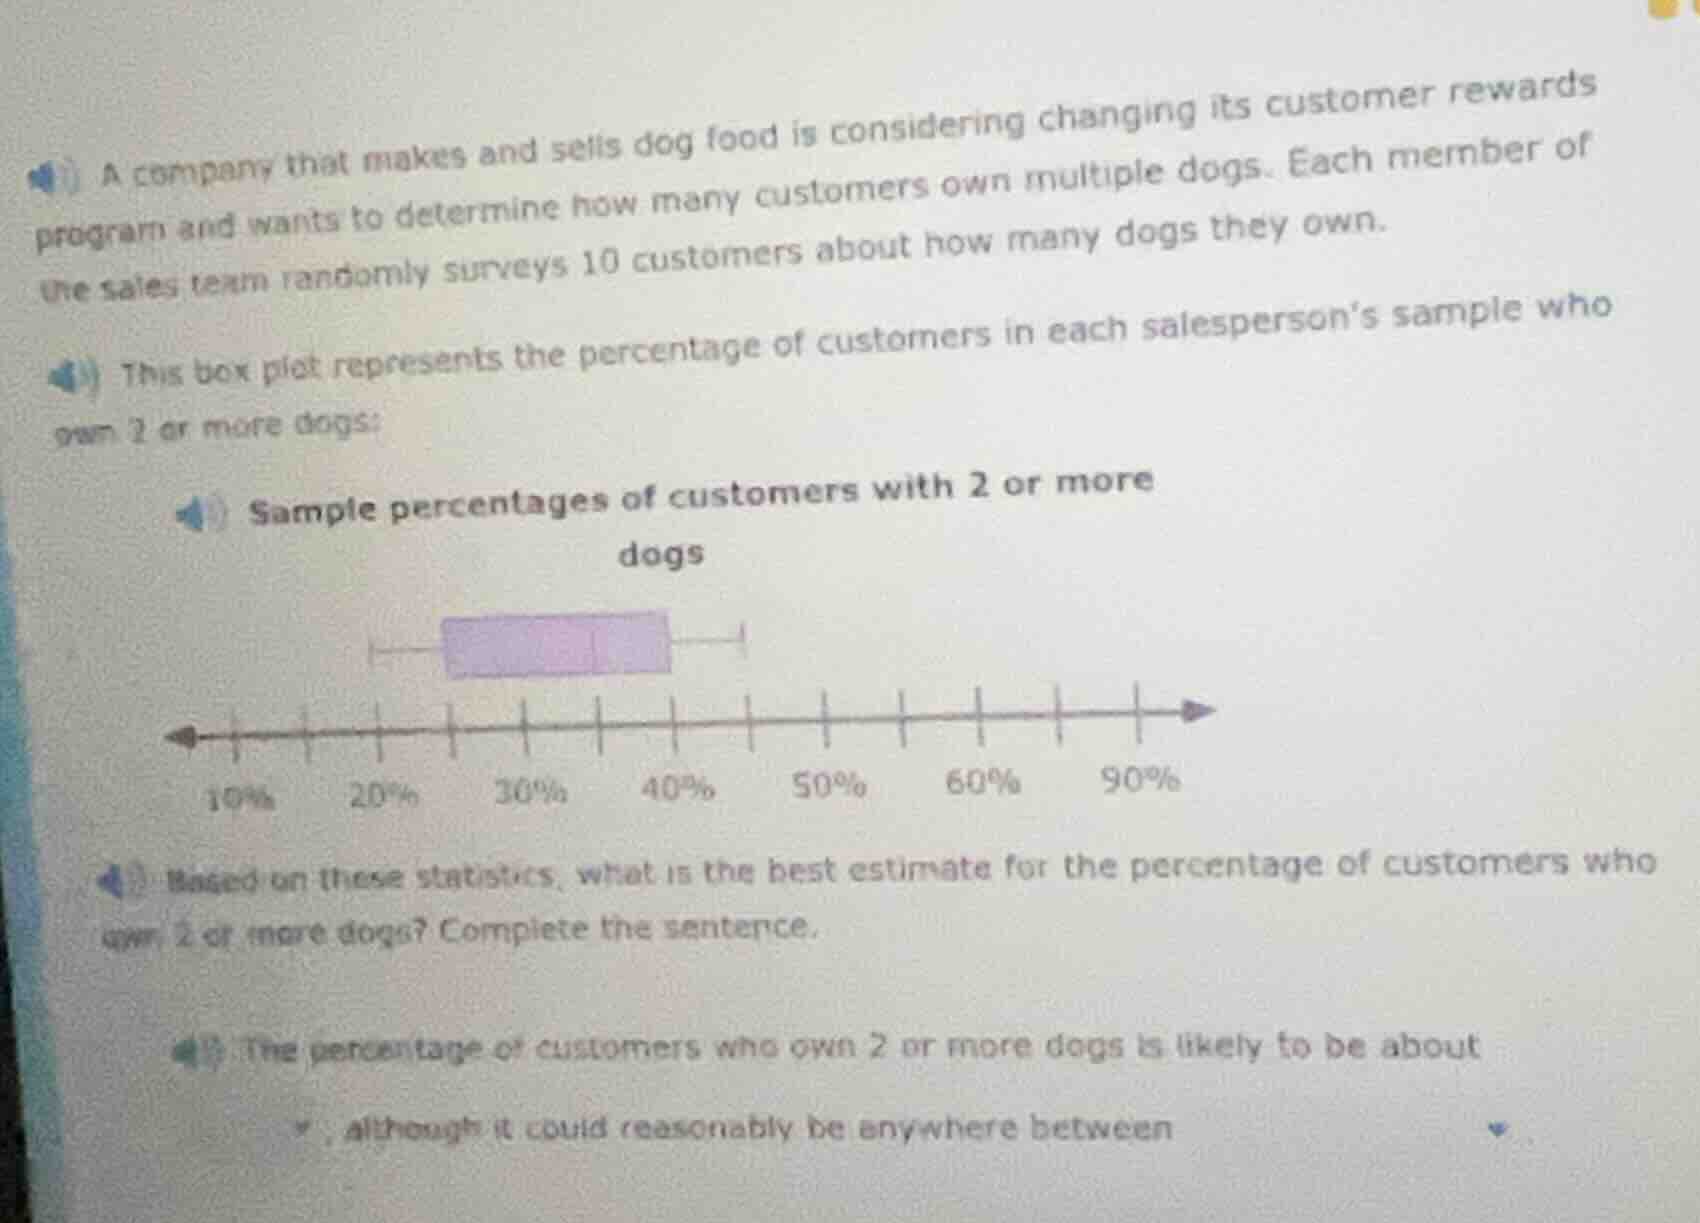
a company that makes and sells dog food is considering changing its customer rewards program and wants to determine how many customers own multiple dogs. each member of the sales team randomly surveys 10 customers about how many dogs they own. this box plot represents the percentage of customers in each salesperson’s sample who own 2 or more dogs: sample percentages of customers with 2 or more dogs (box plot with axis marked 10%, 20%, 30%, 40%, 50%, 60%, 90%) based on these statistics, what is the best estimate for the percentage of customers who own 2 or more dogs? complete the sentence. the percentage of customers who own 2 or more dogs is likely to be about, although it could reasonably be anywhere between
Step1: Analyze the box plot's median (best estimate)
The box plot's median (line inside the box) is around 30% - 35%, but looking at the scale, the center of the box (median) is best estimated as 30% (or a value around the middle of the box; from the plot, the box is centered around 30 - 40, but median is the middle line. Assuming the box is from 25% to 40% with median 30% for simplicity, the best estimate (median) is about 30%.
Step2: Analyze the whiskers (range)
The whiskers (the lines outside the box) extend from around 20% to 45% (estimating from the plot: left whisker to ~20%, right whisker to ~45%). So the range is between 20% and 45% (or more precisely, from the left whisker to right whisker, which from the plot's scale, left is ~20% and right ~45%, but maybe 20% to 45% or similar. Alternatively, if we take the minimum and maximum of the whiskers, left whisker at 20%, right at 45%, so between 20% and 45%.

Snap & solve any problem in the app
Get step-by-step solutions on Sovi AI
Photo-based solutions with guided steps
Explore more problems and detailed explanations
The percentage of customers who own 2 or more dogs is likely to be about $\boldsymbol{30\%}$, although it could reasonably be anywhere between $\boldsymbol{20\%}$ and $\boldsymbol{45\%}$ (or more precise estimates based on the box plot's exact whisker positions; if the left whisker is at 20% and right at 45%, then the range is 20% to 45%).