QUESTION IMAGE
Question
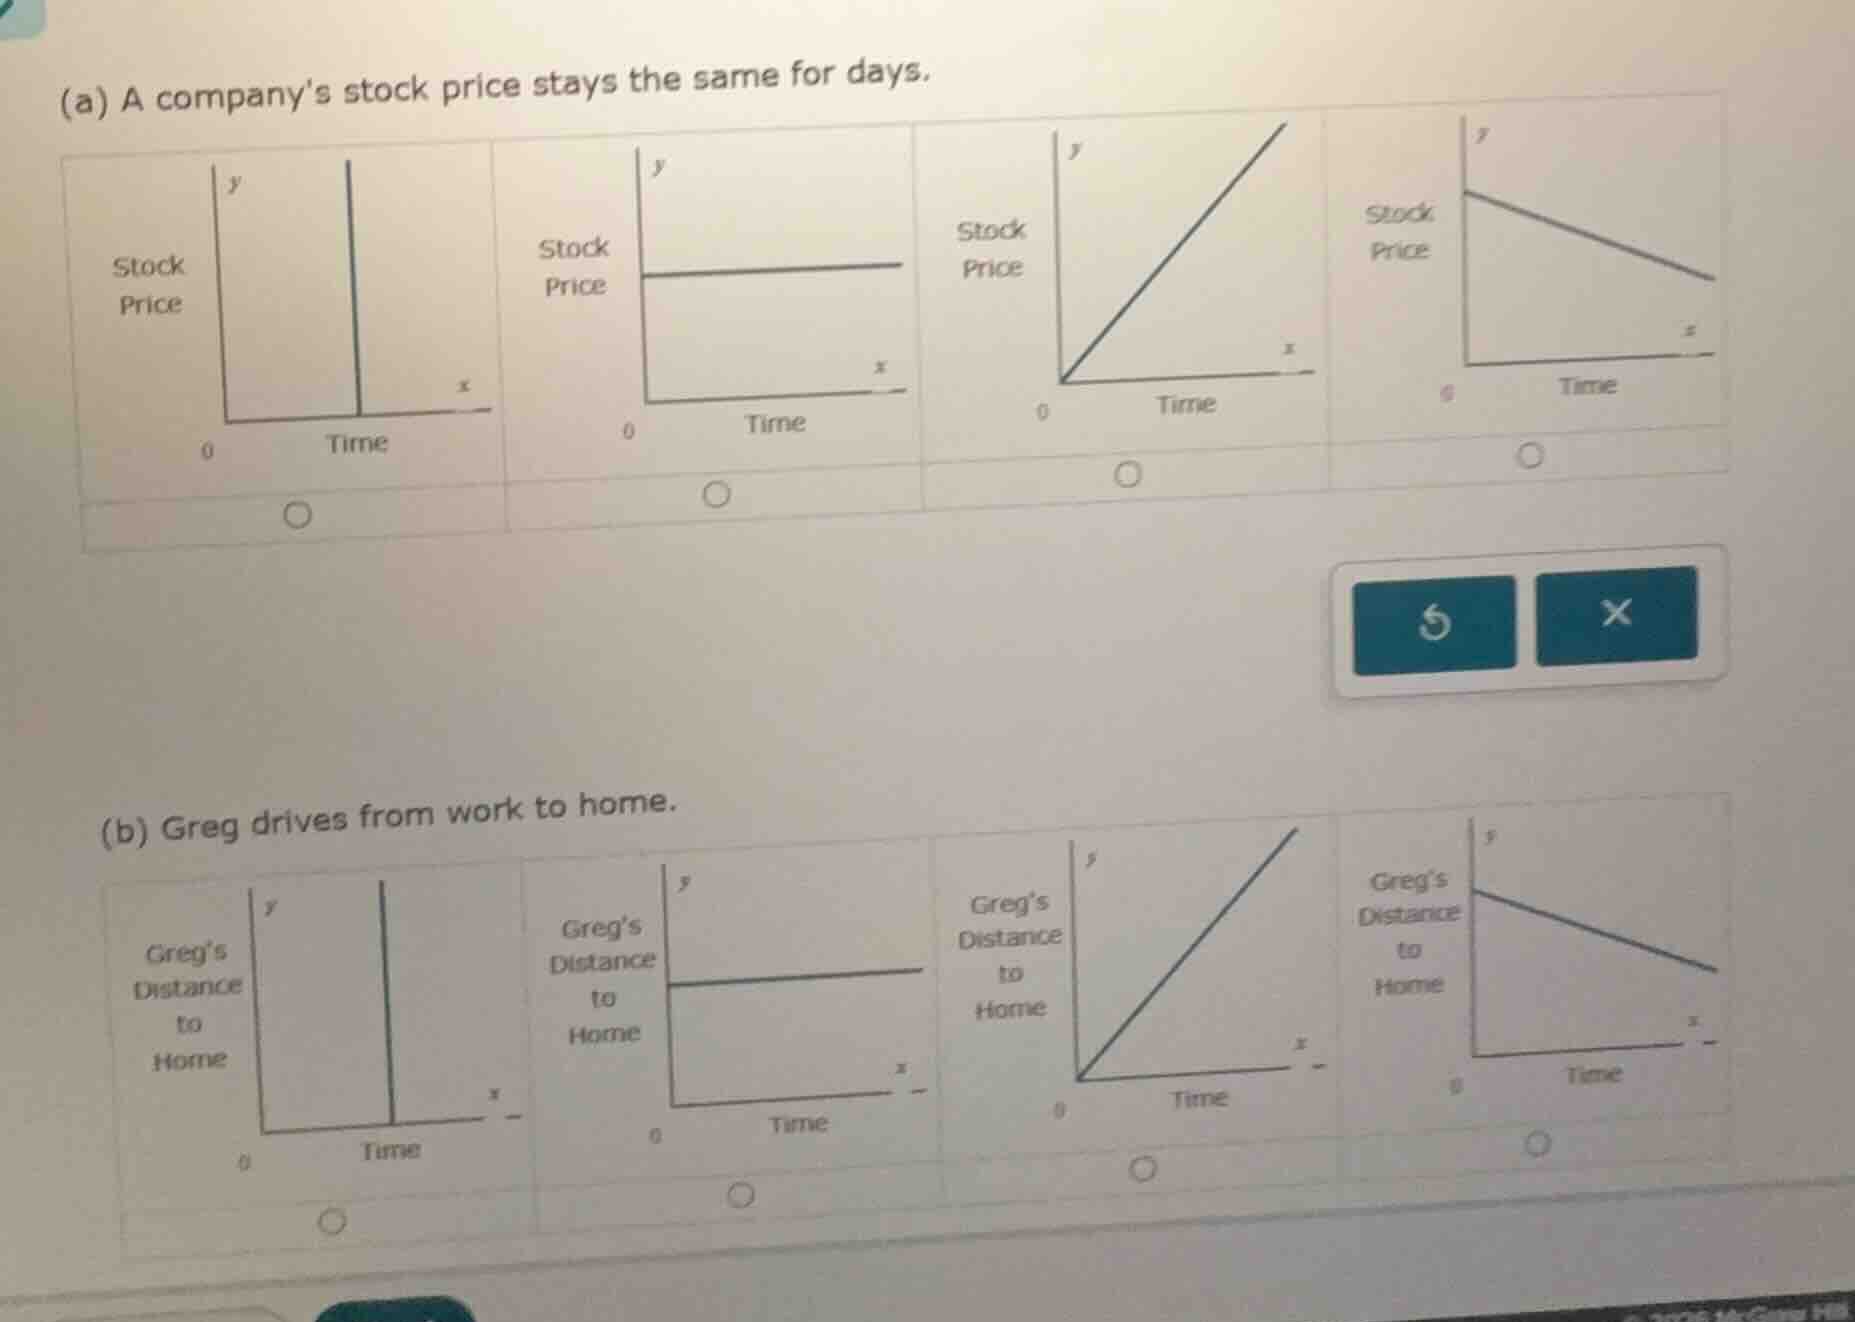
(a) a companys stock price stays the same for days.
(b) greg drives from work to home.
Part (a)
Step1: Analyze the situation
The company's stock price stays the same over days. So, the graph should have a constant \( y \)-value (stock price) as \( x \)-value (time) increases.
Step2: Identify the correct graph
The second graph (from the left) has a horizontal line, meaning \( y \) (stock price) is constant as \( x \) (time) changes. The first graph has a vertical line (not representing constant price over time), the third has an increasing line (price increasing), and the fourth has a decreasing line (price decreasing). So the correct graph is the second one (with the horizontal line for stock price).
Part (b)
Step1: Analyze the situation
Greg drives from work to home, so his distance to home should decrease as time ( \( x \)) increases.
Step2: Identify the correct graph
The fourth graph (from the left) has a line with a negative slope, meaning \( y \) (distance to home) decreases as \( x \) (time) increases. The first graph is vertical (not representing distance over time), the second is horizontal (distance constant, not driving towards home), the third is increasing (distance to home increasing, which would mean moving away). So the correct graph is the fourth one (with the decreasing line for distance to home).

Snap & solve any problem in the app
Get step-by-step solutions on Sovi AI
Photo-based solutions with guided steps
Explore more problems and detailed explanations
(a) The second graph (with horizontal line for stock price).
(b) The fourth graph (with decreasing line for distance to home).