QUESTION IMAGE
Question
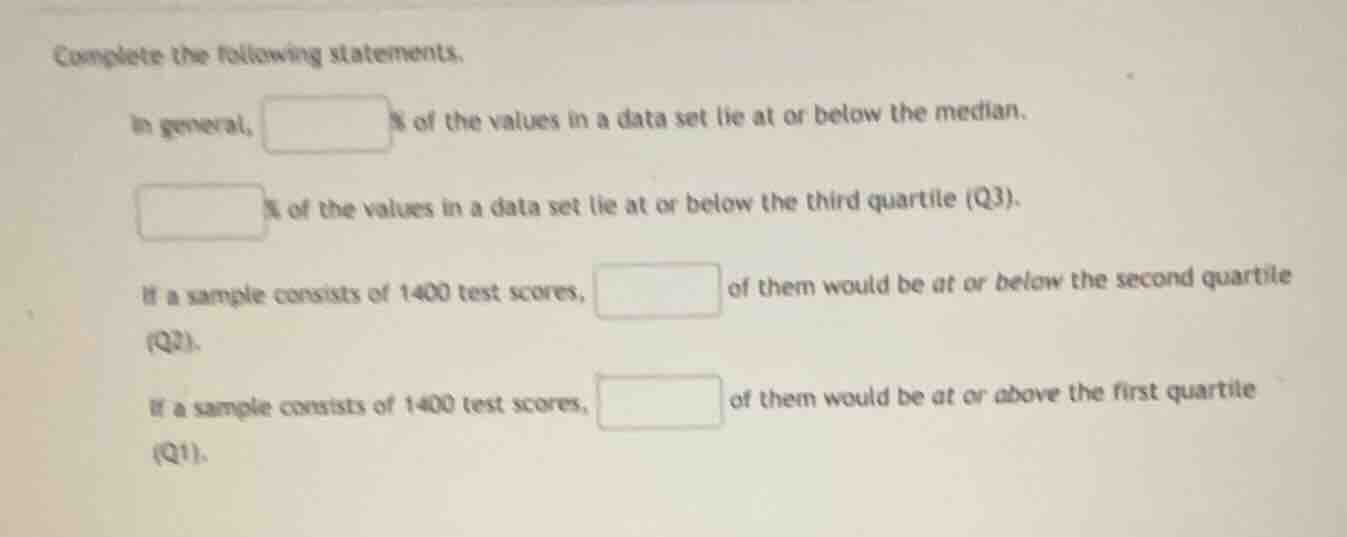
complete the following statements.
in general, \boxed{}% of the values in a data set lie at or below the median.
\boxed{}% of the values in a data set lie at or below the third quartile (q3).
if a sample consists of 1400 test scores, \boxed{} of them would be at or below the second quartile (q2).
if a sample consists of 1400 test scores, \boxed{} of them would be at or above the first quartile (q1).
Step1: Recall median (Q2) definition
The median (second quartile, Q2) divides the data set into two equal parts. So 50% of values lie at or below it.
Step2: Recall third quartile (Q3) definition
The third quartile (Q3) is the value where 75% of the data lies at or below it (since quartiles divide data into four parts, each 25%, so 3 parts = 75%).
Step3: Calculate number at or below Q2 (median)
For 1400 test scores, 50% of 1400 is $0.5\times1400 = 700$.
Step4: Calculate number at or above Q1
First quartile (Q1) has 25% of data below it, so 75% (100% - 25%) lies at or above it. 75% of 1400 is $0.75\times1400 = 1050$.

Snap & solve any problem in the app
Get step-by-step solutions on Sovi AI
Photo-based solutions with guided steps
Explore more problems and detailed explanations
In general, $\boldsymbol{50}$% of the values in a data set lie at or below the median.
$\boldsymbol{75}$% of the values in a data set lie at or below the third quartile (Q3).
If a sample consists of 1400 test scores, $\boldsymbol{700}$ of them would be at or below the second quartile (Q2).
If a sample consists of 1400 test scores, $\boldsymbol{1050}$ of them would be at or above the first quartile (Q1).