QUESTION IMAGE
Question
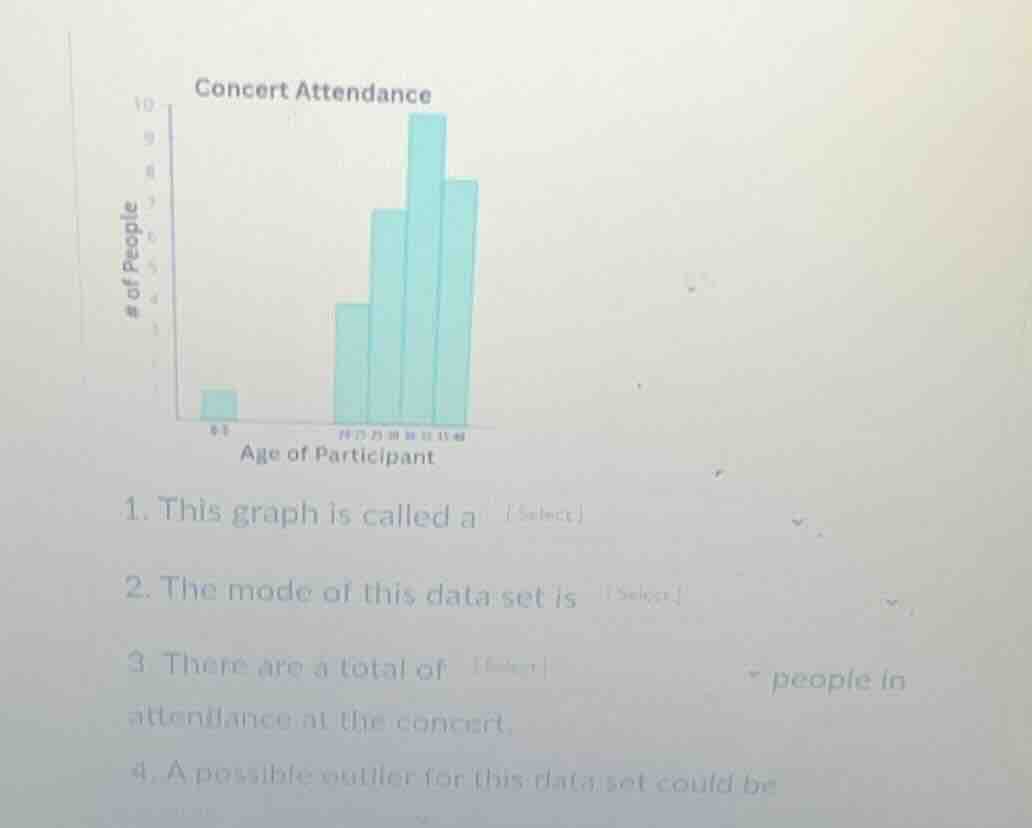
concert attendance
of people
age of participant
- this graph is called a select
- the mode of this data set is select
- there are a total of enter people in attendance at the concert.
- a possible outlier for this data set could be
Brief Explanations
- This type of graph uses vertical bars to represent frequency of data in groups, which defines it as a histogram.
- The mode of a histogram is the group (age range) with the tallest bar, which is the age range with the highest number of attendees.
- To find total attendees, sum the height of each bar: $1 + 3 + 7 + 10 + 8$.
- An outlier is a data point far from the rest; the smallest bar (age group with 1 person) is separated from the other clustered bars, so this age group is the outlier.

Snap & solve any problem in the app
Get step-by-step solutions on Sovi AI
Photo-based solutions with guided steps
Explore more problems and detailed explanations
- histogram
- The age range corresponding to the tallest bar (the 10-person bar)
- 29
- The age group with only 1 attendee (the leftmost bar's age range)