QUESTION IMAGE
Question
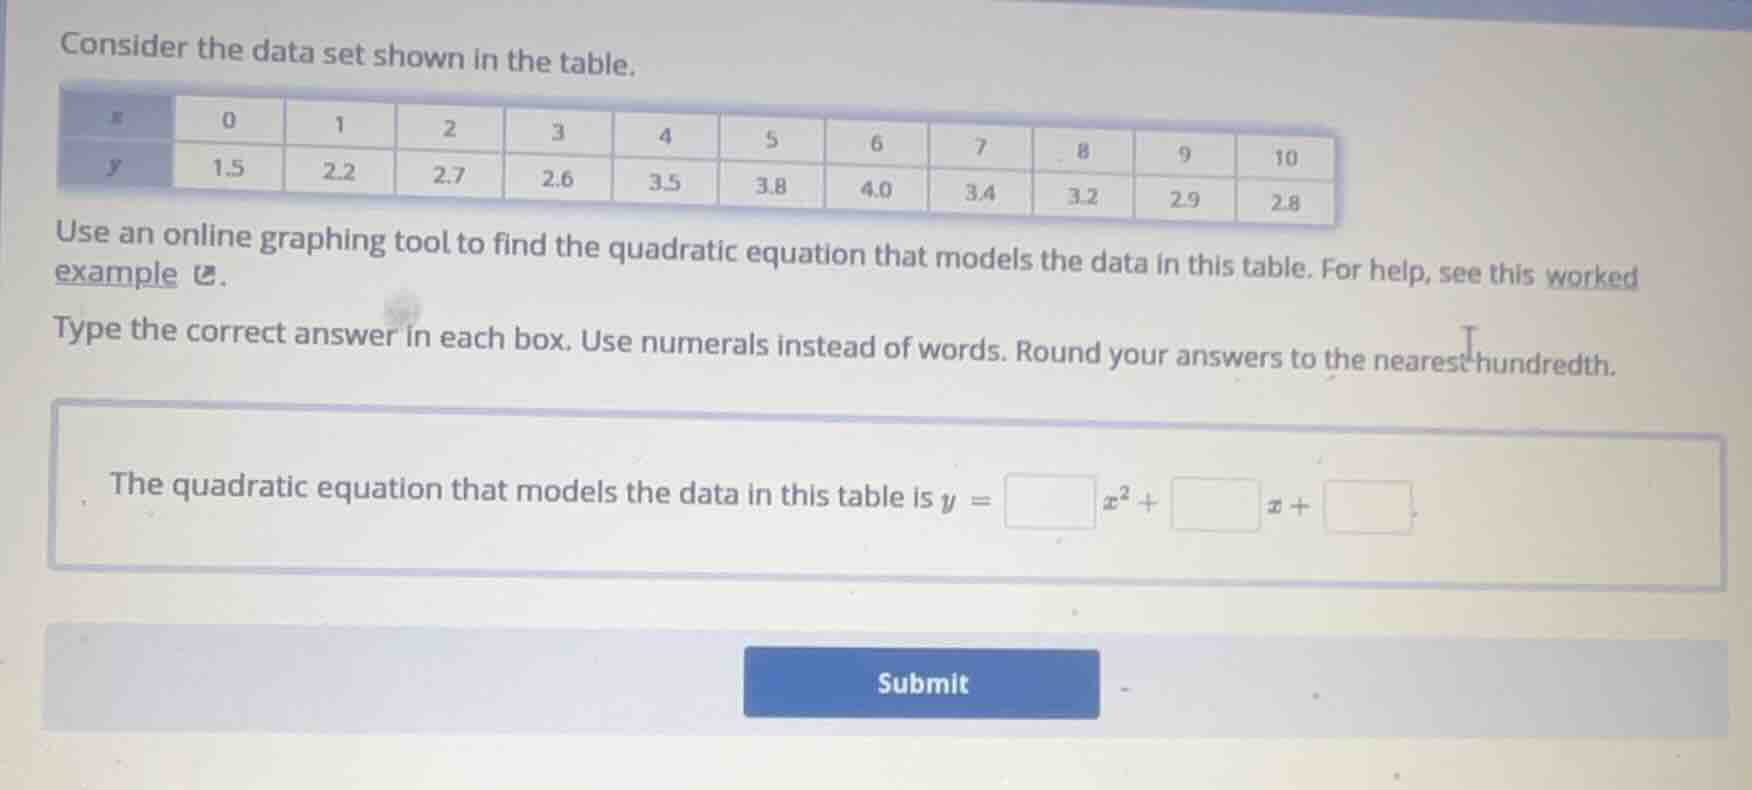
consider the data set shown in the table.
x | 0 | 1 | 2 | 3 | 4 | 5 | 6 | 7 | 8 | 9 | 10
y | 1.5 | 2.2 | 2.7 | 2.6 | 3.5 | 3.8 | 4.0 | 3.4 | 3.2 | 2.9 | 2.8
use an online graphing tool to find the quadratic equation that models the data in this table. for help, see this worked example.
type the correct answer in each box. use numerals instead of words. round your answers to the nearest hundredth.
the quadratic equation that models the data in this table is y = \\(\square\\)\\(x^2\\) + \\(\square\\)x + \\(\square\\).
Step1: Recall quadratic model form
A quadratic model has the form $y = ax^2 + bx + c$, where $a$, $b$, $c$ are coefficients to be found using the given data.
Step2: Input data to regression tool
Enter the paired $(x,y)$ values: $(0,1.5), (1,2.2), (2,2.7), (3,2.6), (4,3.5), (5,3.8), (6,4.0), (7,3.4), (8,3.2), (9,2.9), (10,2.8)$ into a quadratic regression calculator.
Step3: Round coefficients to hundredths
The regression tool outputs $a \approx -0.08$, $b \approx 0.83$, $c \approx 1.52$ after rounding to the nearest hundredth.

Snap & solve any problem in the app
Get step-by-step solutions on Sovi AI
Photo-based solutions with guided steps
Explore more problems and detailed explanations
The quadratic equation that models the data in this table is $y = -0.08x^2 + 0.83x + 1.52$