QUESTION IMAGE
Question
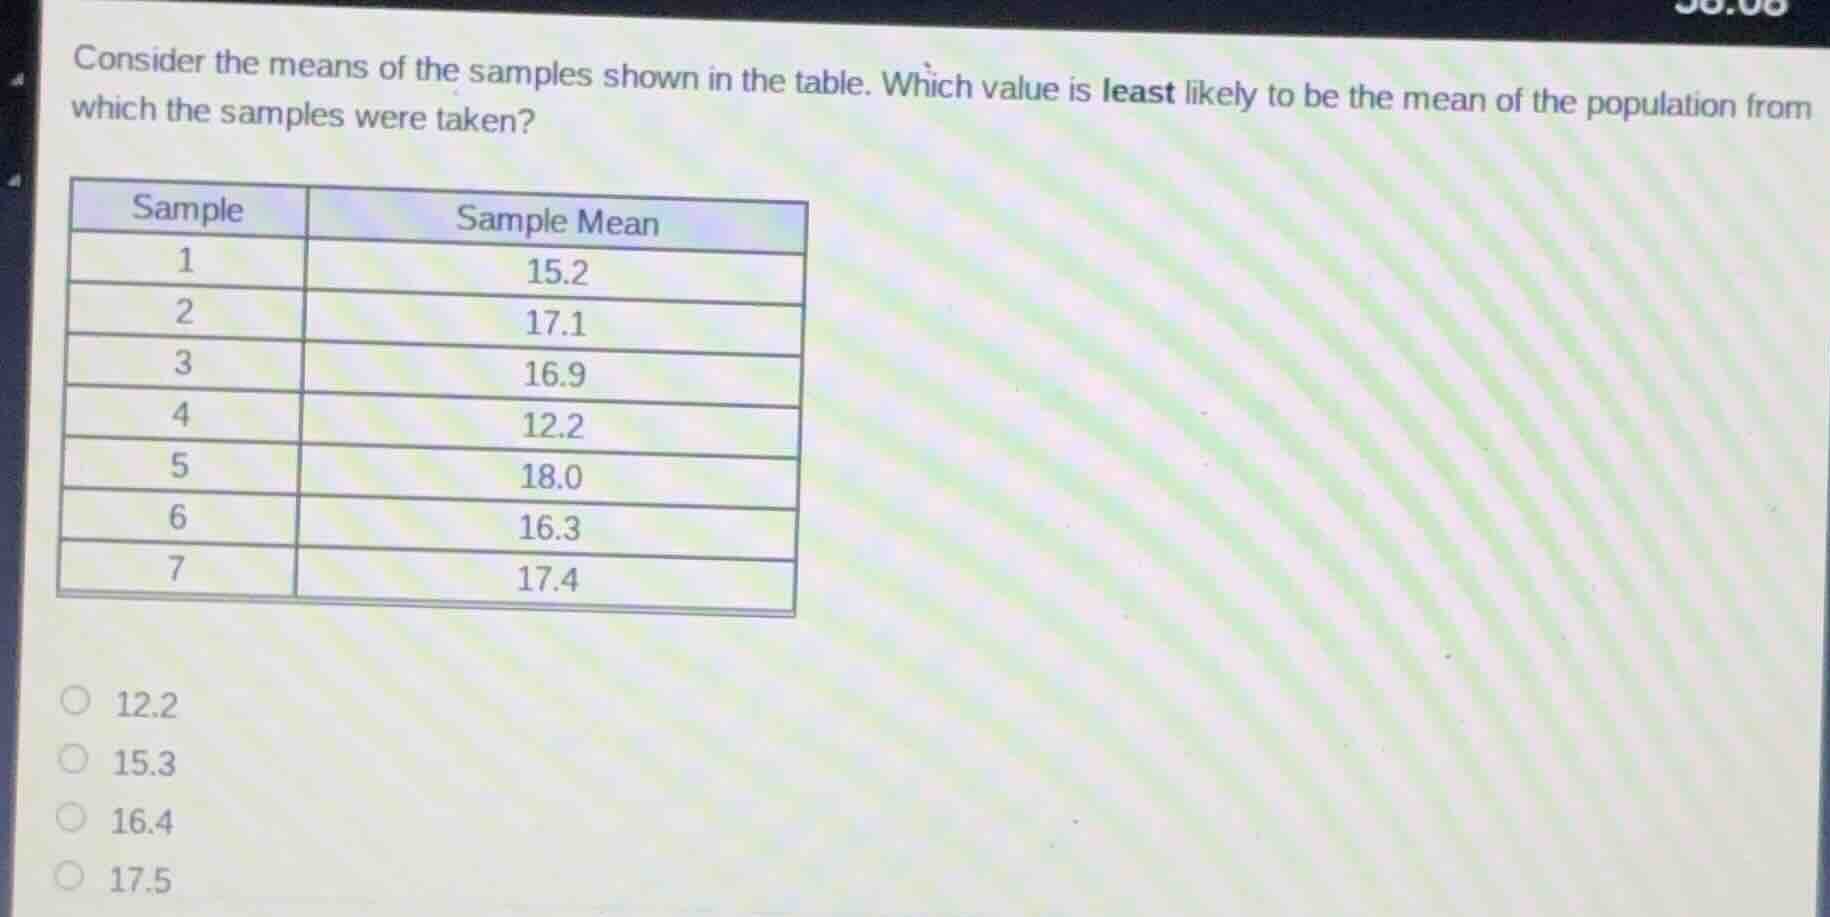
consider the means of the samples shown in the table. which value is least likely to be the mean of the population from which the samples were taken?
sample | sample mean
1 | 15.2
2 | 17.1
3 | 16.9
4 | 12.2
5 | 18.0
6 | 16.3
7 | 17.4
options: 12.2, 15.3, 16.4, 17.5
Step1: Calculate overall sample mean
First, sum all sample means, then divide by the number of samples.
Sum of sample means: $15.2 + 17.1 + 16.9 + 12.2 + 18.0 + 16.3 + 17.4 = 113.1$
Number of samples: $7$
Overall sample mean: $\frac{113.1}{7} = 16.16$
Step2: Compare options to the mean
Calculate the absolute difference between each option and the overall sample mean:
- $|12.2 - 16.16| = 3.96$
- $|15.3 - 16.16| = 0.86$
- $|16.4 - 16.16| = 0.24$
- $|17.5 - 16.16| = 1.34$
Step3: Identify the farthest value
The value with the largest difference is the least likely to be the population mean.

Snap & solve any problem in the app
Get step-by-step solutions on Sovi AI
Photo-based solutions with guided steps
Explore more problems and detailed explanations
12.2