QUESTION IMAGE
Question
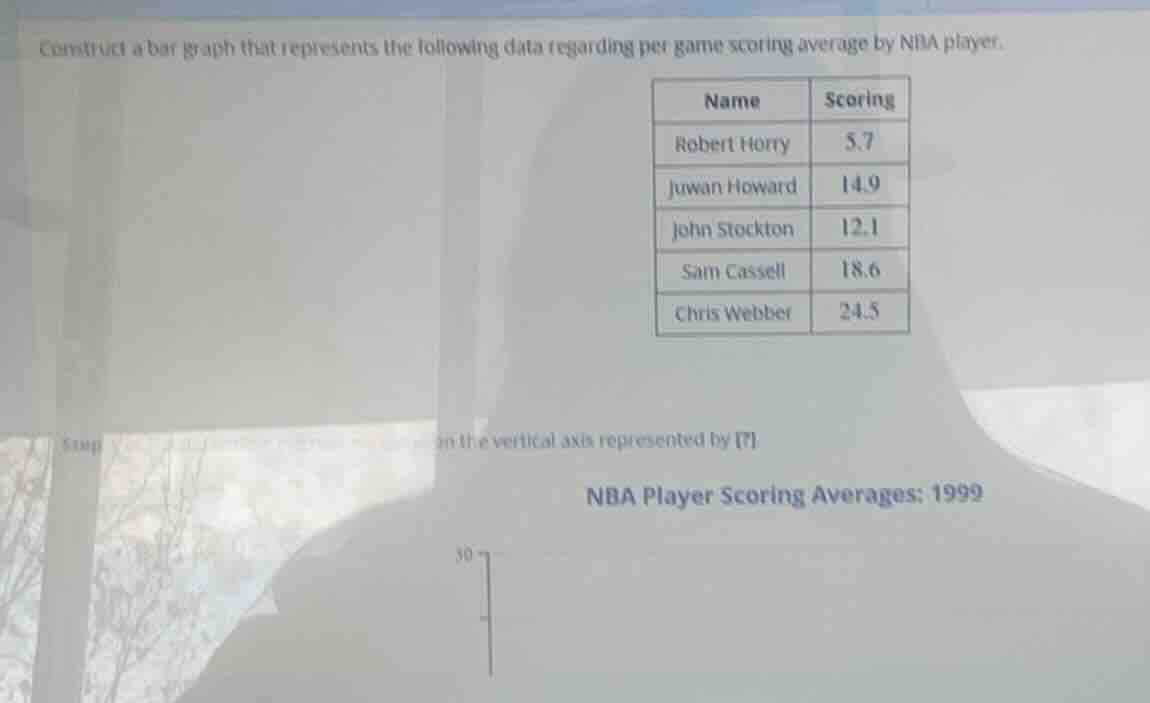
construct a bar graph that represents the following data regarding per game scoring average by nba player.
name scoring
robert horry 5.7
juwan howard 14.9
john stockton 12.1
sam cassell 18.6
chris webber 24.5
in the vertical axis represented by 7
nba player scoring averages: 1999
Step1: Set up graph axes
- Horizontal axis: Label with player names (Robert Horry, Juwan Howard, John Stockton, Sam Cassell, Chris Webber)
- Vertical axis: Label "Scoring Average (Points per Game)", set scale from 0 to 30 with intervals of 5
Step2: Plot bars for each player
- Robert Horry: Bar height = 5.7
- Juwan Howard: Bar height = 14.9
- John Stockton: Bar height = 12.1
- Sam Cassell: Bar height = 18.6
- Chris Webber: Bar height = 24.5
Step3: Add graph title
Title: "NBA Player Scoring Averages: 1999"

Snap & solve any problem in the app
Get step-by-step solutions on Sovi AI
Photo-based solutions with guided steps
Explore more problems and detailed explanations
A bar graph with:
- Horizontal axis labeled with the 5 NBA player names
- Vertical axis labeled "Scoring Average (Points per Game)" with scale 0–30
- Bars with heights matching each player's average:
- Robert Horry: 5.7
- Juwan Howard: 14.9
- John Stockton: 12.1
- Sam Cassell: 18.6
- Chris Webber: 24.5
- Title: "NBA Player Scoring Averages: 1999"