QUESTION IMAGE
Question
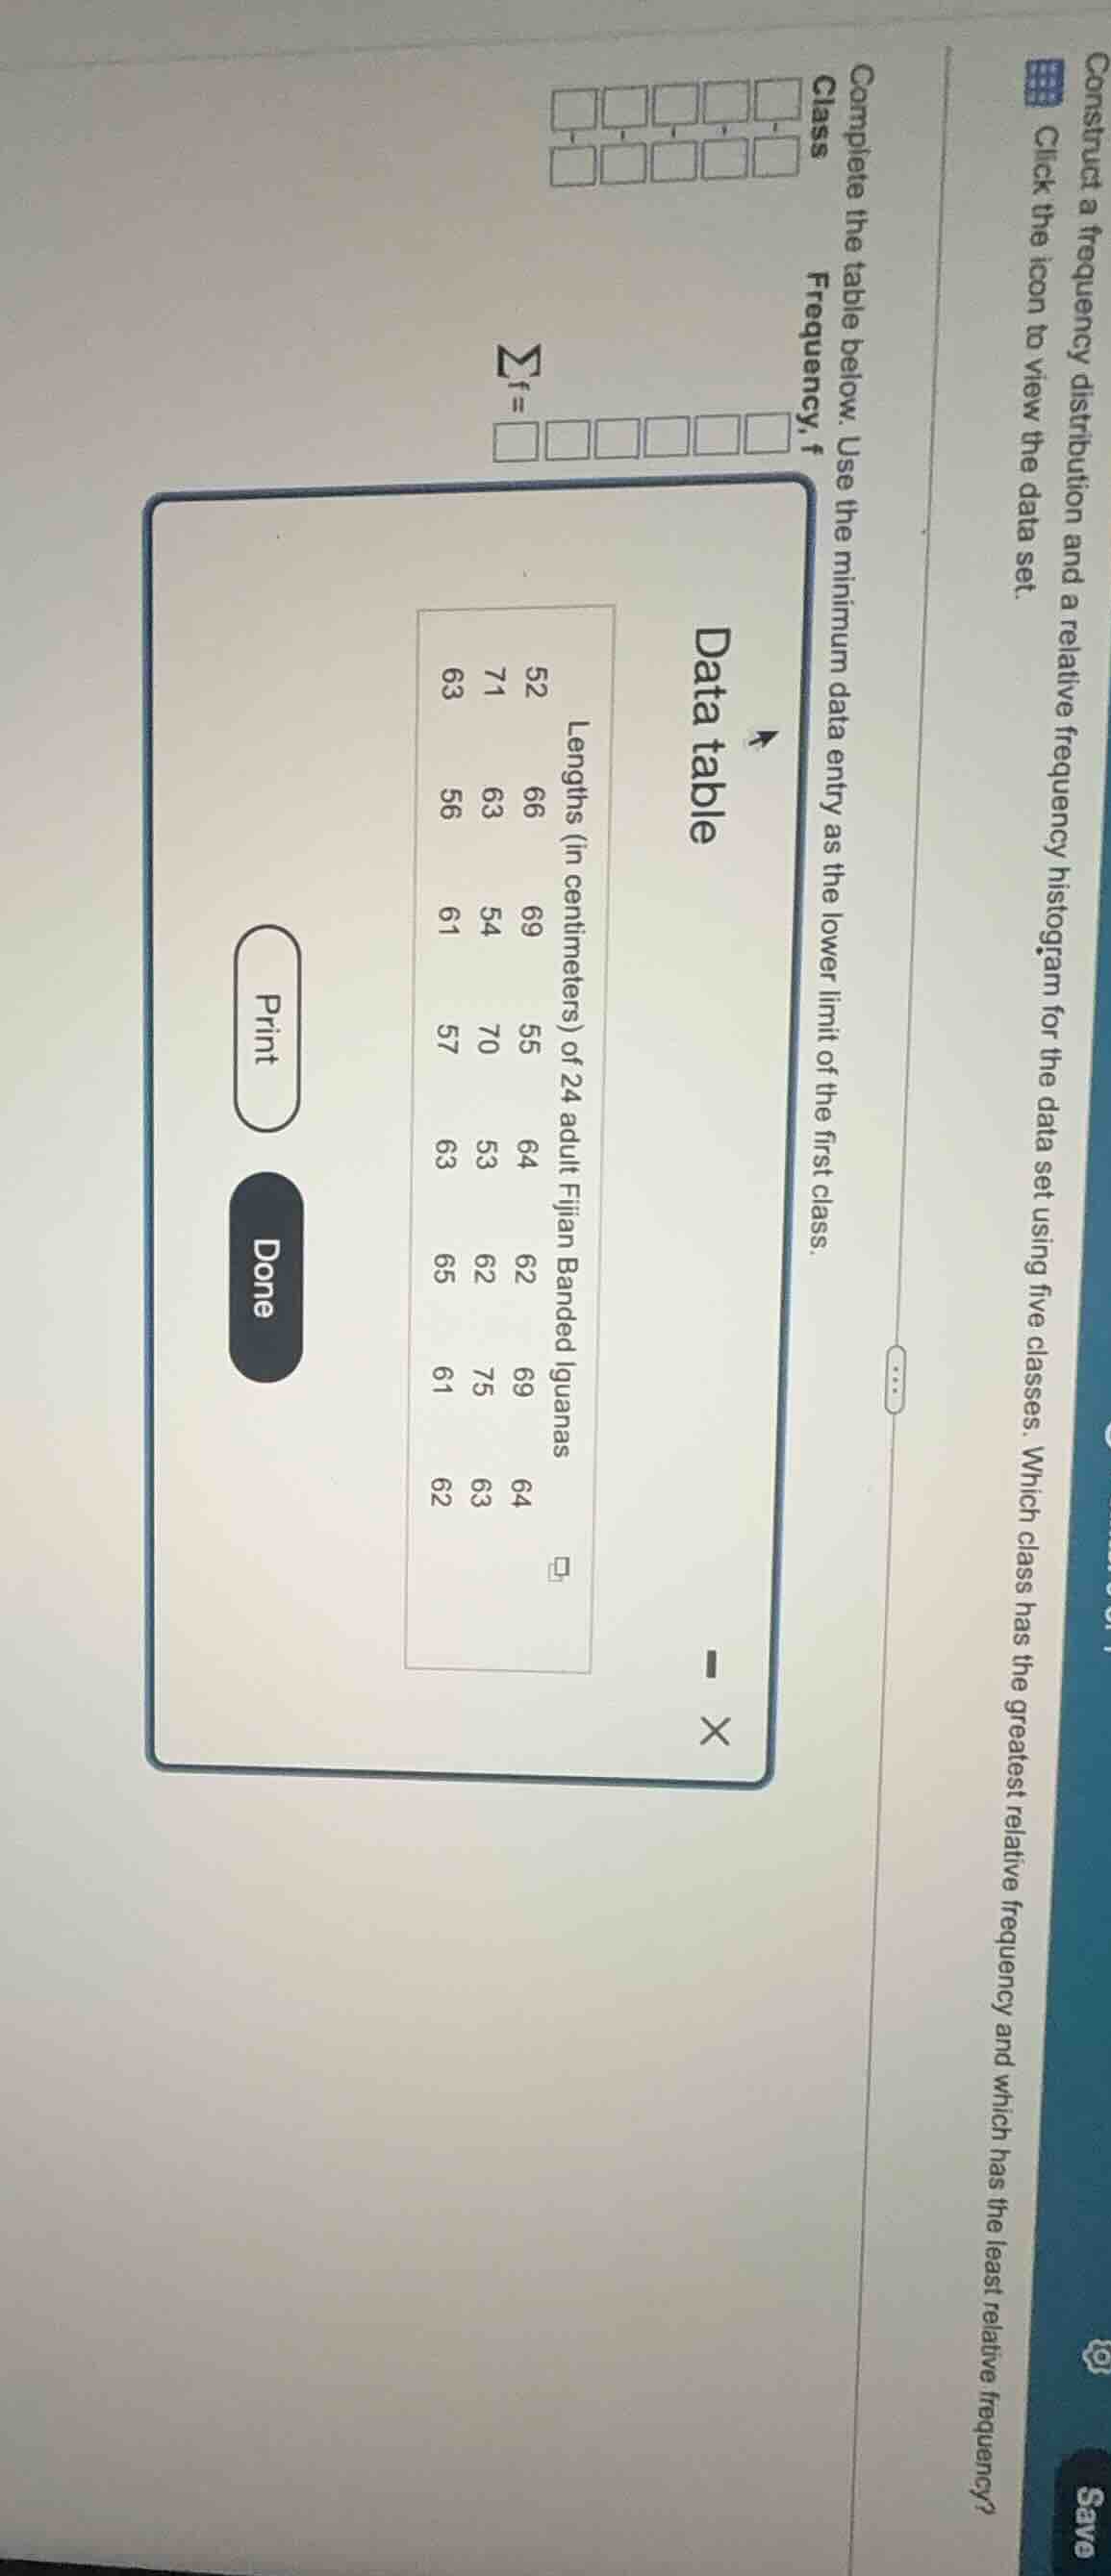
construct a frequency distribution and a relative frequency histogram for the data set using five classes. which class has the greatest relative frequency and which has the least relative frequency? click the icon to view the data set. complete the table below. use the minimum data entry as the lower limit of the first class. class frequency, f \\(\sum f=\\) data table lengths (in centimeters) of 24 adult fijian banded iguanas 52 66 69 55 64 62 69 64 71 63 54 70 53 62 75 63 63 56 61 57 63 65 61 62 print done
Step1: Find the minimum value
The data set is: 52, 66, 69, 55, 64, 62, 69, 64, 71, 63, 54, 70, 53, 62, 75, 63, 63, 56, 61, 57, 63, 65, 61, 62. The minimum value is 52.
Step2: Calculate the class width
The range of the data is \( 75 - 52 = 23 \). We need 5 classes, so the class width is \( \lceil \frac{23}{5}
ceil = 5 \) (we round up to ensure all data is covered).
Step3: Define the classes
The first class is \( 52 - 56 \) (lower limit 52, upper limit 56, since class width is 5). Then the classes are:
- \( 52 - 56 \)
- \( 57 - 61 \)
- \( 62 - 66 \)
- \( 67 - 71 \)
- \( 72 - 76 \)
Step4: Count the frequency for each class
- For \( 52 - 56 \): Data points are 52, 55, 54, 53, 56. So frequency \( f = 5 \).
- For \( 57 - 61 \): Data points are 57, 61, 61. So frequency \( f = 3 \).
- For \( 62 - 66 \): Data points are 66, 64, 62, 62, 63, 63, 63, 65, 62, 63. Let's count: 66 (1), 64 (2), 62 (3), 62 (4), 63 (5), 63 (6), 63 (7), 65 (8), 62 (9), 63 (10). So frequency \( f = 10 \).
- For \( 67 - 71 \): Data points are 69, 69, 71, 70. So frequency \( f = 4 \).
- For \( 72 - 76 \): Data point is 75. So frequency \( f = 1 \).
Step5: Calculate relative frequency
Relative frequency \( = \frac{\text{Frequency}}{\text{Total number of data points}} \). Total number of data points is 24.
- \( 52 - 56 \): \( \frac{5}{24} \approx 0.2083 \)
- \( 57 - 61 \): \( \frac{3}{24} = 0.125 \)
- \( 62 - 66 \): \( \frac{10}{24} \approx 0.4167 \)
- \( 67 - 71 \): \( \frac{4}{24} \approx 0.1667 \)
- \( 72 - 76 \): \( \frac{1}{24} \approx 0.0417 \)
Step6: Determine the class with greatest and least relative frequency
The class \( 62 - 66 \) has the greatest relative frequency (≈0.4167) and the class \( 72 - 76 \) has the least relative frequency (≈0.0417).

Snap & solve any problem in the app
Get step-by-step solutions on Sovi AI
Photo-based solutions with guided steps
Explore more problems and detailed explanations
The class with the greatest relative frequency is \( 62 - 66 \) and the class with the least relative frequency is \( 72 - 76 \). The frequency table is:
| Class | Frequency, \( f \) |
|---|---|
| \( 57 - 61 \) | 3 |
| \( 62 - 66 \) | 10 |
| \( 67 - 71 \) | 4 |
| \( 72 - 76 \) | 1 |
\(\sum f = 5 + 3 + 10 + 4 + 1 = 24\) (which matches the total number of data points).