QUESTION IMAGE
Question
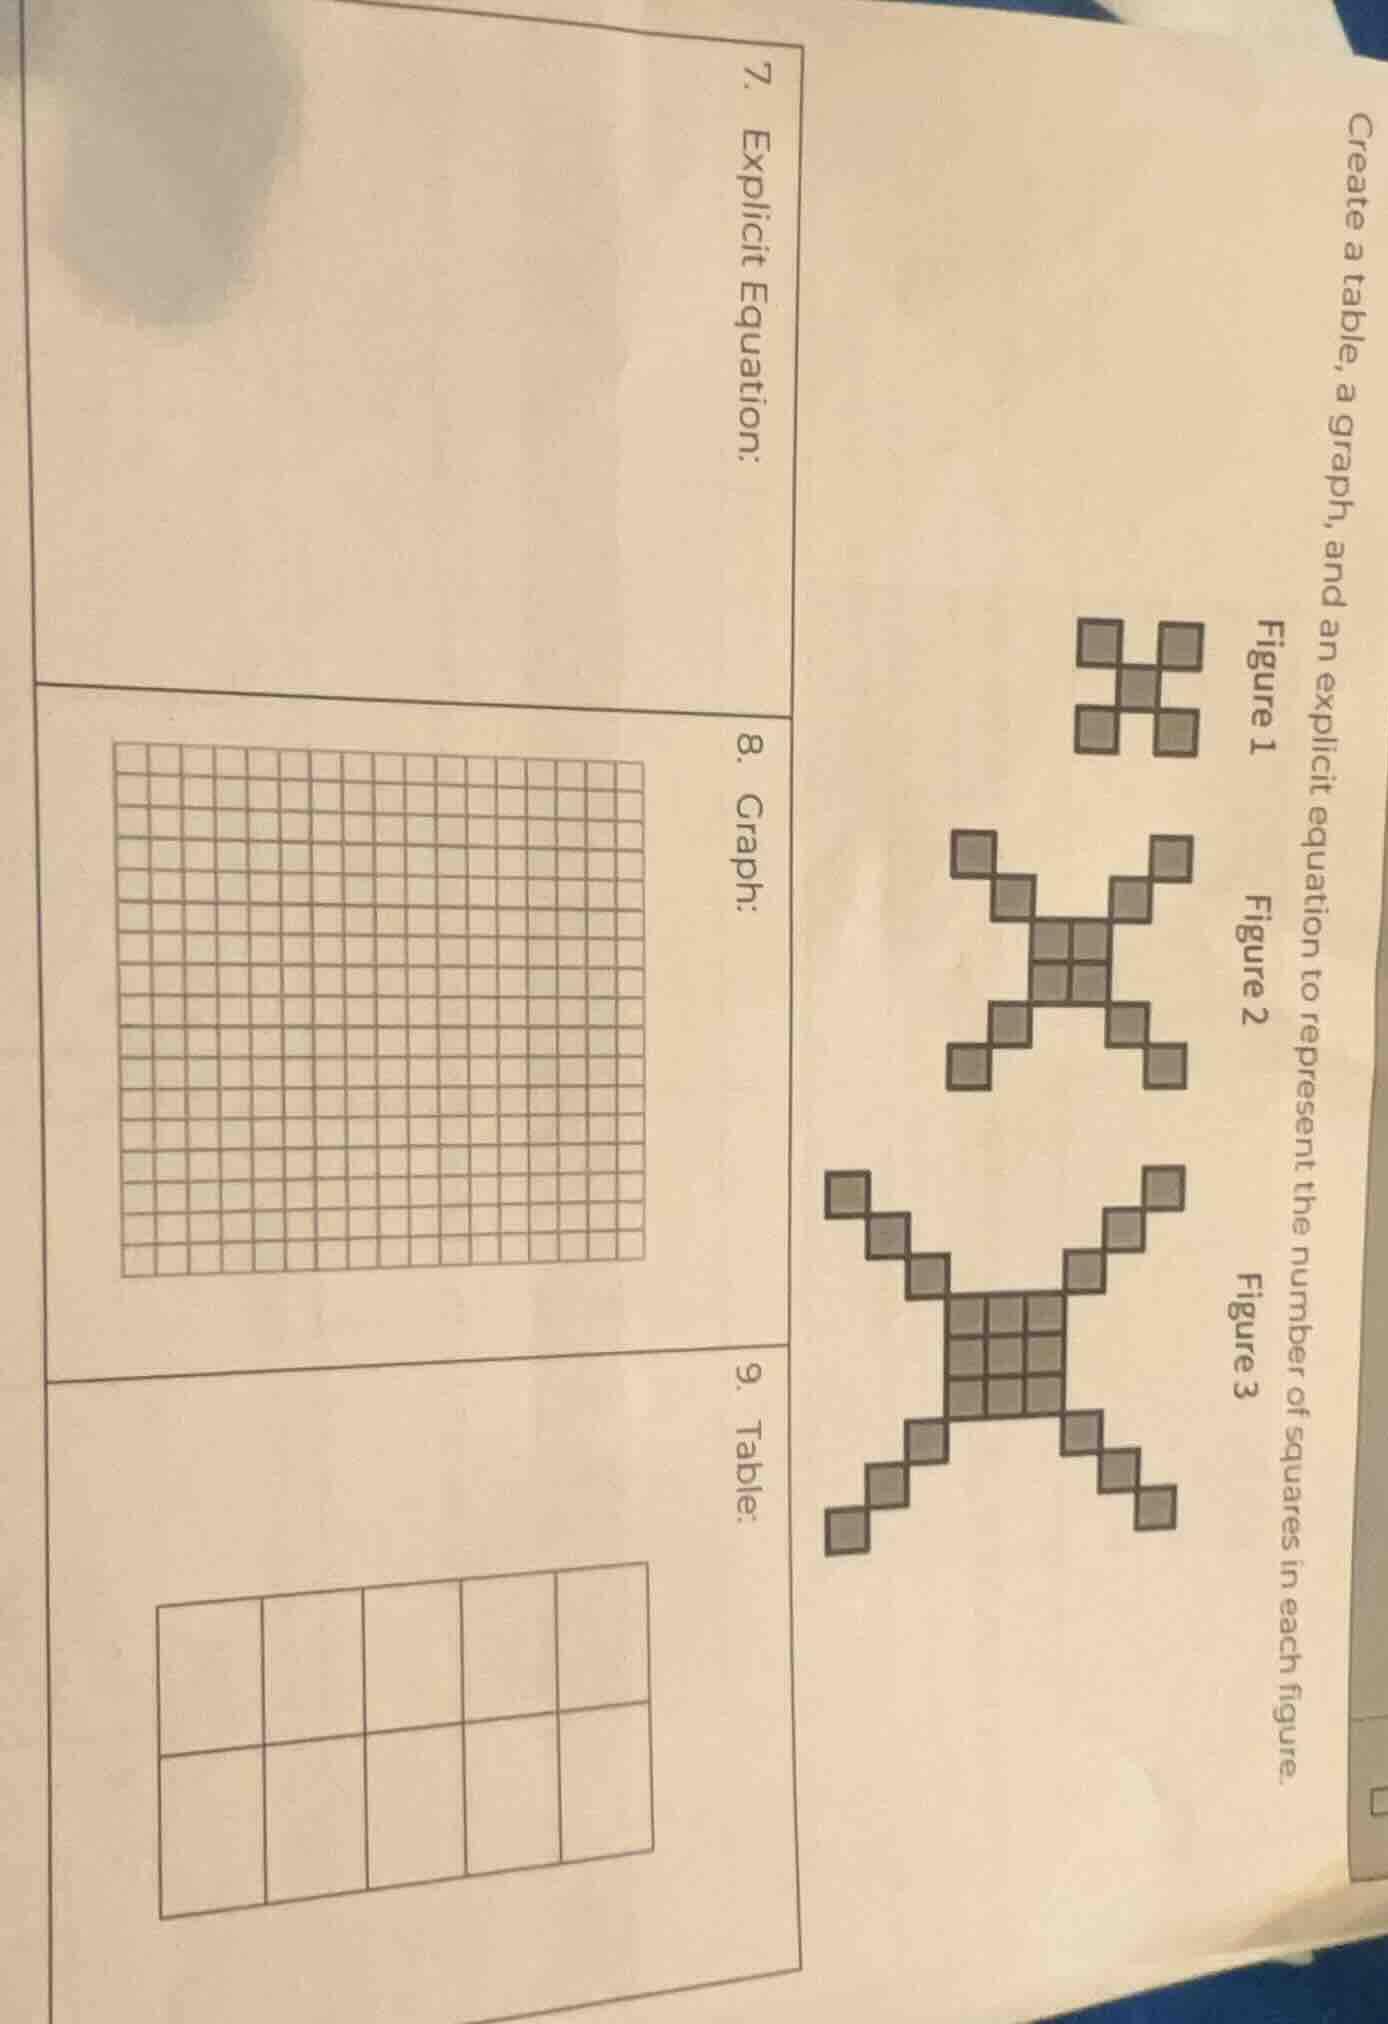
create a table, a graph, and an explicit equation to represent the number of squares in each figure.
figure 1
figure 2
figure 3
- explicit equation:
- graph:
- table:
Step1: Count squares per figure
- Figure 1: 5 squares
- Figure 2: 13 squares
- Figure 3: 21 squares
Step2: Build the table
Define $n$ as figure number, $S(n)$ as number of squares.
| $n$ (Figure Number) | 1 | 2 | 3 |
|---|
Step3: Identify sequence pattern
Calculate the common difference:
$13-5=8$, $21-13=8$. This is an arithmetic sequence with first term $a_1=5$, common difference $d=8$.
The explicit formula for an arithmetic sequence is:
$$S(n) = a_1 + (n-1)d$$
Substitute values:
$$S(n) = 5 + (n-1) \times 8$$
Simplify:
$$S(n) = 8n - 3$$
Step4: Prepare graph points
Use the table values: $(1,5)$, $(2,13)$, $(3,21)$. Plot these on the grid, with the x-axis as figure number and y-axis as number of squares, then draw a straight line through the points.

Snap & solve any problem in the app
Get step-by-step solutions on Sovi AI
Photo-based solutions with guided steps
Explore more problems and detailed explanations
9. Table:
| Figure Number | 1 | 2 | 3 |
|---|
7. Explicit Equation:
$S(n) = 8n - 3$ (where $n$ is the figure number, $S(n)$ is the number of squares)
8. Graph:
Plot the points $(1, 5)$, $(2, 13)$, $(3, 21)$ on the grid, with the horizontal axis labeled "Figure Number" and vertical axis labeled "Number of Squares", then draw a straight line passing through these points.