QUESTION IMAGE
Question
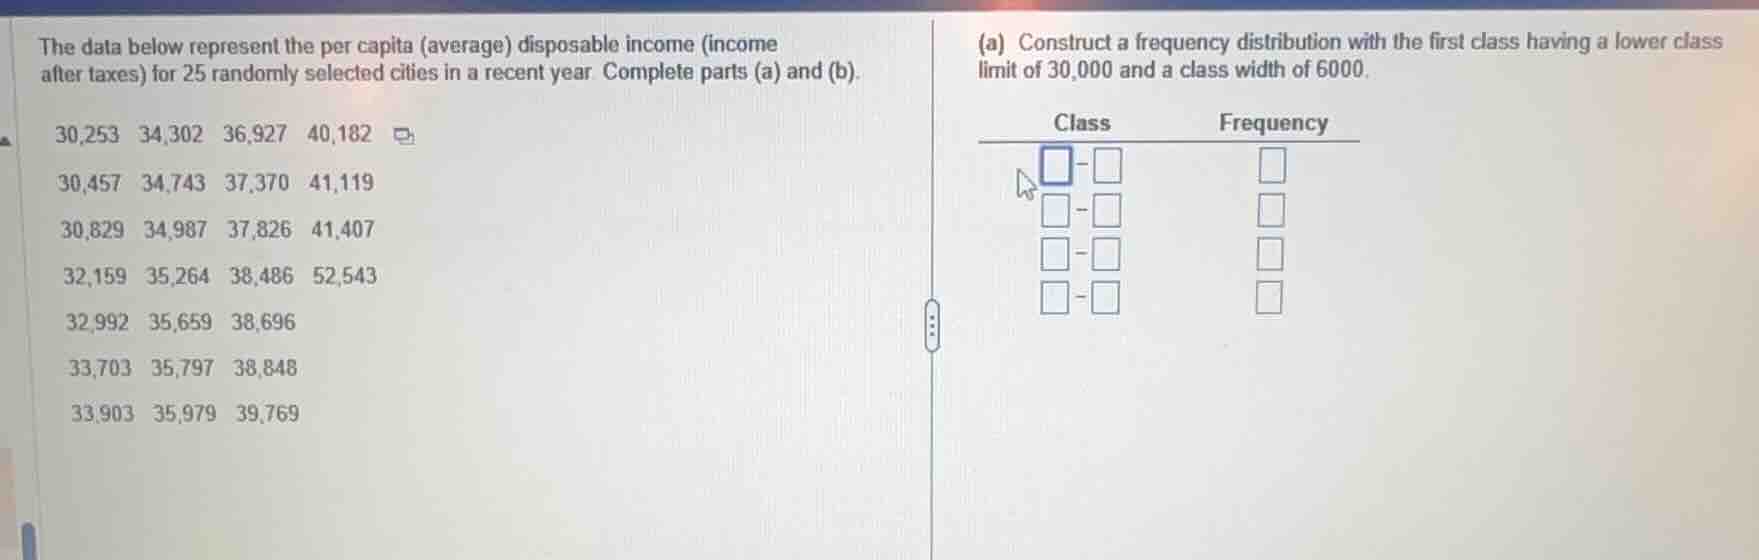
the data below represent the per capita (average) disposable income (income after taxes) for 25 randomly selected cities in a recent year complete parts (a) and (b). 30,253 34,302 36,927 40,182 30,457 34,743 37,370 41,119 30,829 34,987 37,826 41,407 32,159 35,264 38,486 52,543 32,992 35,659 38,696 33,703 35,797 38,848 33,903 35,979 39,769 (a) construct a frequency distribution with the first class having a lower class limit of 30,000 and a class width of 6000. class frequency \\(\square - \square\\) \\(\square\\) \\(\square - \square\\) \\(\square\\) \\(\square - \square\\) \\(\square\\) \\(\square - \square\\) \\(\square\\)
Step1: Define class intervals
First class: lower limit = 30,000, width = 6000. Upper limit = $30000 + 6000 - 1 = 35999$.
Next classes: add 6000 to lower limit each time:
- $30000-35999$
- $36000-41999$
- $42000-47999$
- $48000-53999$
Step2: Count values per class
- For $30000-35999$: Count values between 30,000 and 35,999:
30,253; 30,457; 30,829; 32,159; 32,992; 33,703; 33,903; 34,302; 34,743; 34,987; 35,264; 35,659; 35,797; 35,979 → 14 values
- For $36000-41999$: Count values between 36,000 and 41,999:
36,927; 37,370; 37,826; 38,486; 38,696; 38,848; 39,769; 40,182; 41,119; 41,407 → 10 values
- For $42000-47999$: No values fall in this range → 0
- For $48000-53999$: Only 52,543 → 1 value

Snap & solve any problem in the app
Get step-by-step solutions on Sovi AI
Photo-based solutions with guided steps
Explore more problems and detailed explanations
| Class | Frequency |
|---|---|
| 36000-41999 | 10 |
| 42000-47999 | 0 |
| 48000-53999 | 1 |